
by Yung L. Leung
Real world data structures: tables and graphs in JavaScript

An aerial view of boxes with addresses, each containing people & various items, shows neighborhoods connected by their roads. Viewed up close, you may say that we have a hash table. But, when viewed from afar, you might see a graph. Advancing from linear (linked lists, stacks & queues) and binary (binary search trees, binary heaps) data structures, hash tables, and graphs are steps towards a greater diversity of real-world applications.
Tables
A hash table represents data (key-value pairs) tabulated by indexes.
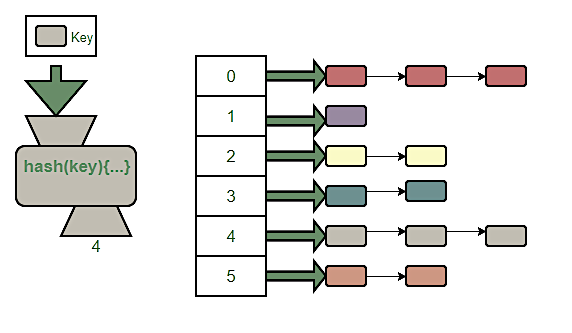
Each unique key is used to generate an index (hash function). A hash function can generate the same index for several unique keys (collision). A solution to this problem is to store the data sets under the same index (chaining).
So, you can imagine a hash table being a system for shelving similar items together. Simply enter the item name into a hash function and all the greenish type items will be assigned a shelf space, i.e. 4.
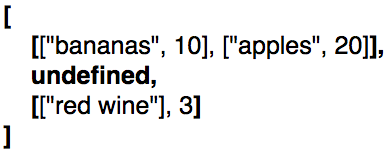
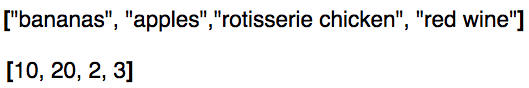
In general, a key-value pair insert requires generating an index (shelf number), checking whether that shelf exists, and placing the item (data) on the shelf. Suppose I had bananas and apples on the bottom shelf (index 0) and red wine on my top shelf (index 2).
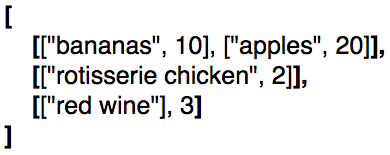
If my index generator (hash function) returned an index 2 for my 2 “rotisserie chickens,” to insert that data requires checking for and creating shelf space.
To get a value (item) requires inputting its name (key) to generate its index (shelf number) and retrieving all items on that shelf. Then searching for the exact item (its name or key) and retrieving it (return value). So, to find how many apples are in stock (20) requires iterating through my shelf of fruits.
To get a list of all keys or values requires searching through each existing shelf, logging it into your manifest (push into an array), and submitting the documents (return keys or values array).
The complexity to insert a key-value pair or access a value is, in general, a constant time (O(1)). A good hash function evenly distributes all items to all available shelves. So, insertion or access does not require looping through all existing “shelves” for storage or retrieval of data.
Because cataloging (keys or values) requires going through all shelves, it has a complexity O(n). For n different data sets (for 4 different items), requires n steps to perform a catalog (requires looking through all 4 items to document its name or its quantity).
Graphs
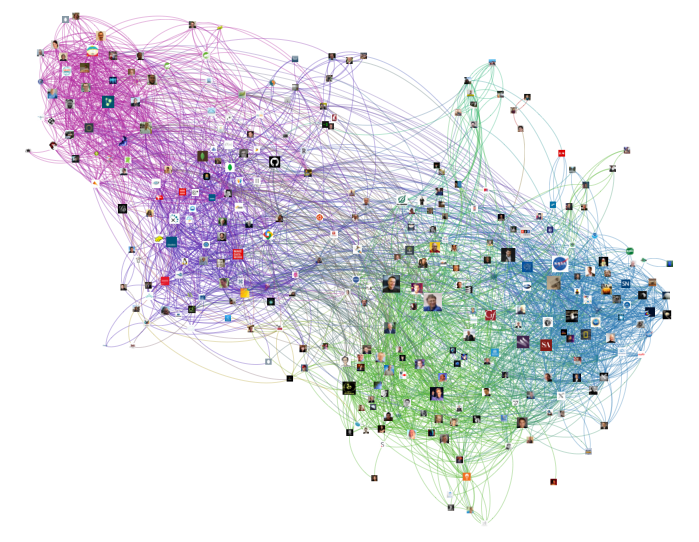
A graph is nodes (vertices) of data related by their connections (edges). A road map of cities connected by their roads is a graph. A graph of connected users from a social media app is another example.
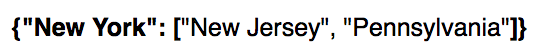
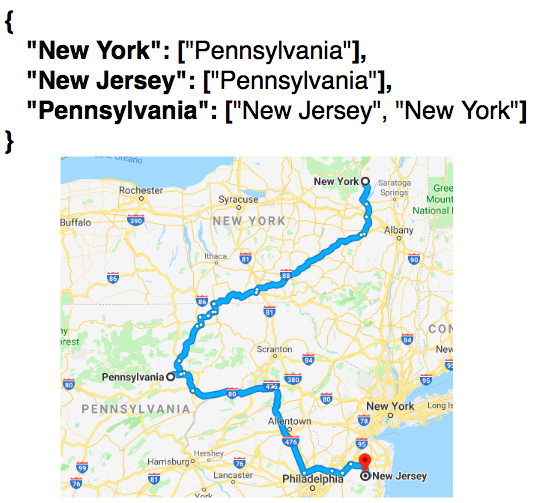
To add a vertex and an edge requires storing them as key-value pairs in an adjacency list. So a vertex (New York) can be connected to other vertices (New Jersey & Pennsylvania) by making “New York” a key to an array containing “New Jersey,” “Pennsylvania.”
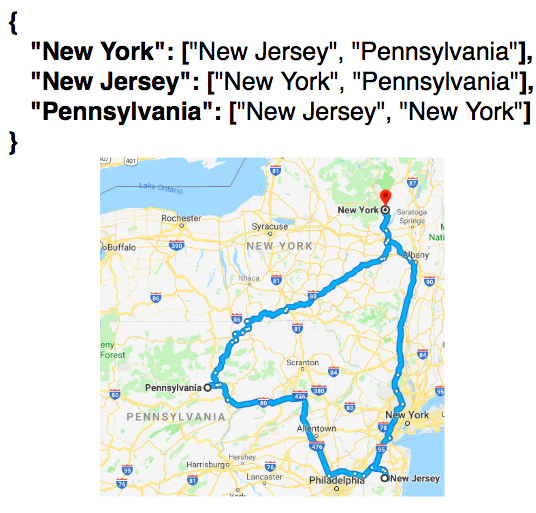
The reverse must also be implemented, i.e.: “New Jersey” pointing to an array of “New York,” “Pennsylvania,” and so forth. So the result is an adjacency list of keys (“New York,” “New Jersey,” “Pennsylvania”), each pointing to arrays of their corresponding connections.
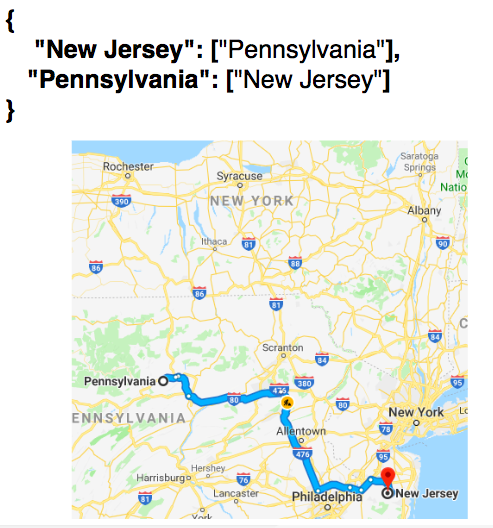
To remove edge requires removing vertex1’s connection to vertex2 and the reverse. So, to remove New York’s connection to New Jersey requires, also, removing New Jersey’s connection to New York.
To remove a vertex requires iterating through its connections. Removing its edges, before finally deleting the vertex from the adjacency list. So, to remove New York requires disconnecting it from its neighbors before deleting from the list.
Relative to a starting point, a depth-first traversal involves visiting a neighbor and its neighbors, before proceeding with the next immediate neighbor. A breadth-first traversal involves visiting all immediate neighbors before distant neighbors.
So for a graph with New York, New Jersey, Pennsylvania & Virginia as vertices, a depth-first traversal starting from New Jersey would be [“New Jersey”, “Pennsylvania”, “Virginia”, “New York”].
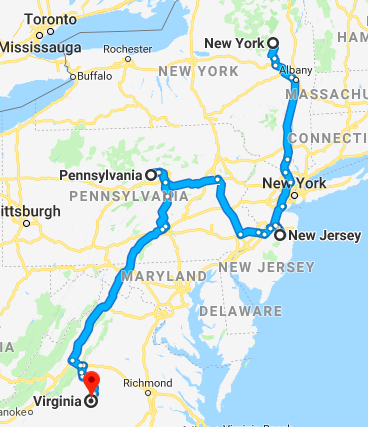
A breadth-first from New Jersey would be [“New Jersey”, “New York”, “Pennsylvania”, “Virginia”].
Since a graph is a set of nodes connected, linear & binary data structures can, in a sense, be viewed as simple graphs. Because graphs can take many different forms & shapes, the complexity of traversal through a graph depends on the algorithm(s) used for the traveling, a discussion best saved for another time.
References:
https://www.udemy.com/js-algorithms-and-data-structures-masterclass/