
by Sacha Greif

Announcing the State of JavaScript 2017 Survey
Let’s find out what’s changed since last year!
In a hurry? You can take the survey here.
When I launched the first State of JavaScript survey last year, it was mostly to scratch my own itch. I wanted to know what libraries were worth learning, and which ones were on the way out.
It turns out, I wasn’t the only one with that itch. Over 9,000 people took the time to answer the survey’s 89 questions. The resulting data was a trove of interesting insights.
For example, we learned that although 11% of respondents had ever tried Vue, 89% of Vue users were happy enough to continue using it. And, on the other hand, although 64% of respondents had used Angular, only 47% of Angular users were looking forward to working with it again.
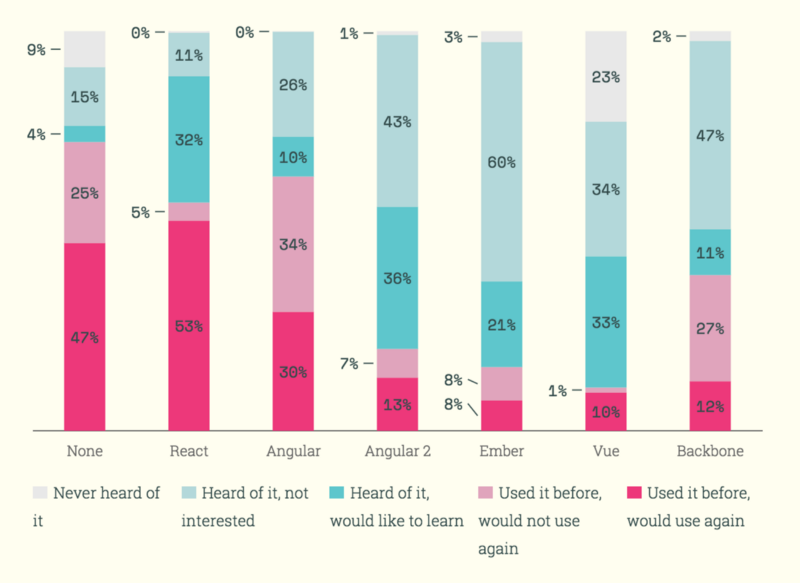
You can find many more data points like this by exploring the 2016 results.
Better Data
So what’s new for 2017? One criticism we got last time was that it wasn’t clear where the data was coming from. Where were the respondents located? How did they hear about the survey?
For that reason, the survey will also track metadata like your referrer, location, browser type, and so on. Of course, it goes without saying that this data will remain completely anonymous.
Hopefully that extra metadata will let us do cool things, like comparing geographic trends, or seeing if respondents coming from, say, Reddit vs Hacker News tend to use different technologies.
New Questions
We made a few changes to the questions. Some technologies are out (like CoffeeScript and Cucumber), while some are in (like Reason and Flow).
Of course, you can still fill in your framework of choice in the “Other” section even if it’s missing from the main options.
We also changed the structure of the question groups slightly. Instead of trying to isolate each layer of the stack in its own group, we now have larger, more inclusive groupings such as “Data Layer” or “Back-end.”
Of course, no organization is perfect. For example, GraphQL, Redux, and Apollo all end up in the same Data Layer group, even though they’re all complementary technologies. But hopefully it’ll still make some amount of sense to you.
A New StateOfJS Team Member
I ran last year’s survey by myself, but since I wanted to do more with the results this time around, I got my friend Michael Rambeau to come on board as well.
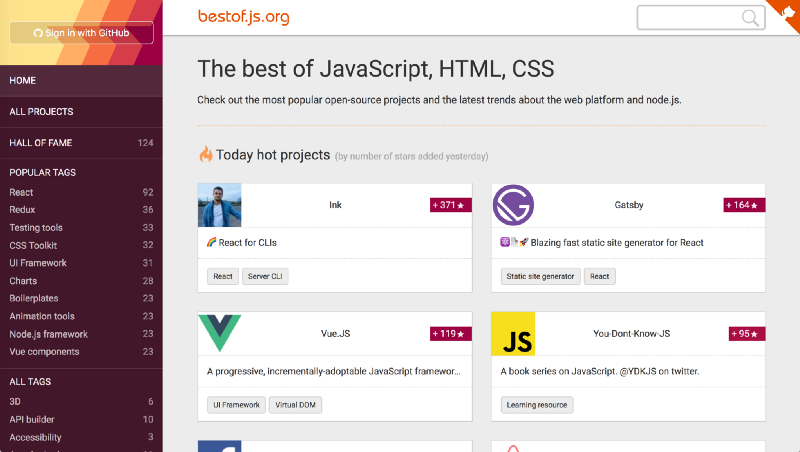
Michael runs BestOfJS, a live directory that tracks open-source JavaScript libraries and provides detailed stats on their popularity. So I think there’s no better person to help with the State of JS project!
Let’s Get Started
But enough talk! Go ahead and take the survey now. See you again a couple weeks from now for the results!