by Usama Ashraf
Apache Storm is awesome. This is why (and how) you should be using it.

Continuous data streams are ubiquitous and are becoming even more so with the increasing number of IoT devices being used. Of course, this means huge volumes of data are stored, processed, and analyzed to provide predictive, actionable results.
But petabytes of data take a long time to analyze, even with tools such as Hadoop (as good as MapReduce may be) or Spark (a remedy to the limitations of MapReduce).
Often, we don’t need to deduce patterns over long periods of time. Of the petabytes of incoming data collected over months, at any given moment, we might not need to take into account all of it, just a real-time snapshot. Perhaps we don’t need to know the longest trending hashtag over five years, but just the one right now.
This is what Apache Storm is built for, to accept tons of data coming in extremely fast, possibly from various sources, analyze it, and publish real-time updates to a UI or some other place… without storing any actual data.
This article is not the ultimate guide to Apache Storm, nor is it meant to be. Storm’s pretty huge, and just one long-read probably can’t do it justice anyways. Of course, any additions, feedback or constructive criticism will be greatly appreciated.
OK, now that that’s out of the way, let’s see what we’ll be covering:
- The necessity of Storm, the ‘why’ of it, what it is and what it isn’t
- A bird’s eye view of how it works.
- What a Storm topology roughly looks like in code (Java)
- Setting up and playing with a production-worthy Storm cluster on Docker.
- A few words on message processing reliability.
I’m also assuming that you’re at least somewhat familiar with Docker and containerization.
How It Works
The architecture of Apache Storm can be compared to a network of roads connecting a set of checkpoints. Traffic begins at a certain checkpoint (called a spout) and passes through other checkpoints (called bolts).
The traffic is of course the stream of data that is retrieved by the spout (from a data source, a public API for example) and routed to various bolts where the data is filtered, sanitized, aggregated, analyzed, and sent to a UI for people to view (or to any other target).
The network of spouts and bolts is called a topology, and the data flows in the form of tuples (list of values that may have different types).
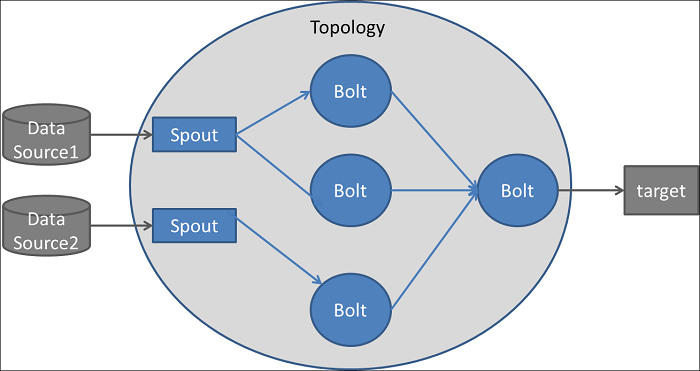
One important thing to talk about is the direction of the data traffic.
Conventionally, we would have one or multiple spouts reading the data from an API, a queuing system, and so on. The data would then flow one-way to one or multiple bolts which may forward it to other bolts and so on. Bolts may publish the analyzed data to a UI or to another bolt.
But the traffic is almost always unidirectional, like a directed acyclic graph (DAG). Although it is certainly possible to make cycles, we’re unlikely to need such a convoluted topology.
Installing a Storm release involves a number of steps, which you’re free to follow on your machine. But later on I’ll be using Docker containers for a Storm cluster deployment, and the images will take care of setting up everything we need.
Some code
While Storm does offer support for other languages, most topologies are written in Java, since it’s the most efficient option we have.
A very basic spout, that just emits random digits, may look like this:
And a simple bolt that takes in the stream of random digits and emits only the even ones:
Another simple bolt that’ll receive the filtered stream from EvenDigitBolt, and just multiply each even digit by 10 and emit it forward:
Putting them together to form our topology:
Parallelism in Storm topologies
Fully understanding parallelism in Storm can be daunting, at least in my experience. A topology requires at least one process to operate on. Within this process, we can parallelize the execution of our spouts and bolts using threads.
In our example, RandomDigitSpout will launch just one thread, and the data spewed from that thread will be distributed among two threads of the EvenDigitBolt.
But the way this distribution happens, referred to as the stream grouping, can be important. For example, you may have a stream of temperature recordings from two cities, where the tuples emitted by the spout look like this:
// City name, temperature, time of recording(“Atlanta”, 94, “2018–05–11 23:14”)(“New York City”, 75, “2018–05–11 23:15”)(“New York City”, 76, “2018–05–11 23:16”)(“Atlanta”, 96, “2018–05–11 23:15”)(“New York City”, 77, “2018–05–11 23:17”)(“Atlanta”, 95, “2018–05–11 23:16”)(“New York City”, 76, “2018–05–11 23:18”)Suppose we’re attaching just one bolt whose job is to calculate the changing average temperature of each city.
If we can reasonably expect that in any given time interval we’ll get roughly an equal number of tuples from both the cities, it would make sense to dedicate two threads to our bolt. We can send the data for Atlanta to one of them and New York to the other.
A fields grouping would serve our purpose, which partitions data among the threads by the value of the field specified in the grouping:
// The tuples with the same city name will go to the same thread.builder.setBolt(“avg-temp-bolt”, new AvgTempBolt(), 2) .fieldsGrouping(“temp-spout”, new Fields(“city_name”));And of course, there are other types of groupings as well. For most cases, though, the grouping probably won’t matter much. You can just shuffle the data and throw it among the bolt threads randomly (shuffle grouping).
Now there’s another important component to this: the number of worker processes that our topology will run on.
The total number of threads that we specified will then be equally divided among the worker processes. So, in our example random digit topology, we had one spout thread, two even-digit bolt threads, and four multiply-by-ten bolt threads (giving seven in total).
Each of the two worker processes would be responsible for running two multiply-by-ten bolt threads, one even-digit bolt, and one of the processes will run the one spout thread.
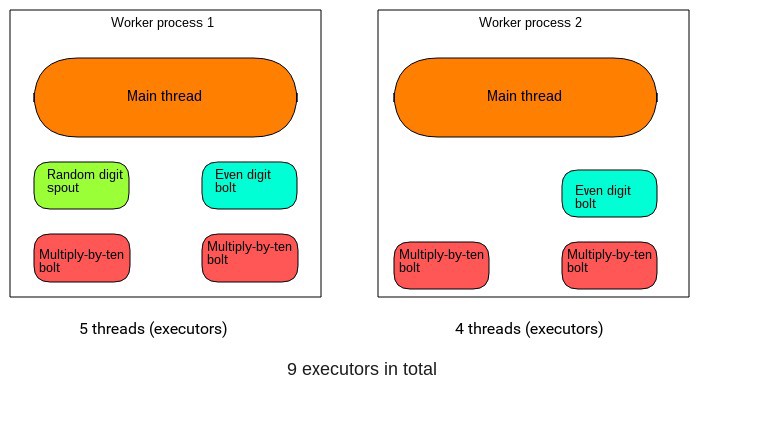
Of course, the two worker processes will have their main threads, which in turn will launch the spout and bolt threads. So all in all we’ll have nine threads. These are collectively called executors.
It’s important to realize that if you set a spout’s parallelism hint to be greater than one (multiple executors), you can end up emitting the same data several times.
Say the spout reads from the public Twitter stream API and uses two executors. That means that the bolts receiving the data from the spout will get the same tweet twice. It is only after the spout emits the tuples that data parallelism comes into play. In other words, the tuples get divided among the bolts according to the specified stream grouping.
Running multiple workers on a single node would be fairly pointless. Later, however, we’ll use a proper, distributed, multi-node cluster and see how workers are divided on different nodes.
Building our topology
Here’s the directory structure I suggest:
yourproject/ pom.xml src/ jvm/ packagename/ RandomDigitSpout.java EvenDigitBolt.java MultiplyByTenBolt.java OurSimpleTopology.javaMaven is commonly used for building Storm topologies, and it requires a pom.xml file (The POM) that defines various configuration details, project dependencies, and so on. Getting into the nitty-gritty of the POM will probably be overkill here.
- First, we’ll run
mvn cleaninsideyourprojectto clear any compiled files we may have, making sure to compile each module from scratch. - And then
mvn packageto compile our code and package it in an executable JAR file, inside a newly createdtargetfolder. This might take quite a few minutes the first time, especially if your topology has many dependencies. - To submit our topology:
storm jar target/packagename-{version number}.jar packagename.OurSimpleTopology
Hopefully by now the gap between concept and code in Storm has been somewhat bridged. However, no serious Storm deployment will be a single topology instance running on one server.
What a Storm cluster looks like
To take full advantage of Storm’s scalability and fault-tolerance, any production-grade topology would be submitted to a cluster of machines.
Storm distributions are installed on the primary node (Nimbus) and all the replica nodes (Supervisors).
The primary node runs the Storm Nimbus daemon and the Storm UI. The replica nodes run the Storm Supervisor daemons. A Zookeeper daemon on a separate node is used for coordination among the primary node and the replica nodes.
Zookeeper, by the way, is only used for cluster management and never any kind of message passing. It’s not like spouts and bolts are sending data to each other through it or anything like that. The Nimbus daemon finds available Supervisors via ZooKeeper, to which the Supervisor daemons register themselves. It also carries out other managerial tasks, some of which will become clear shortly.
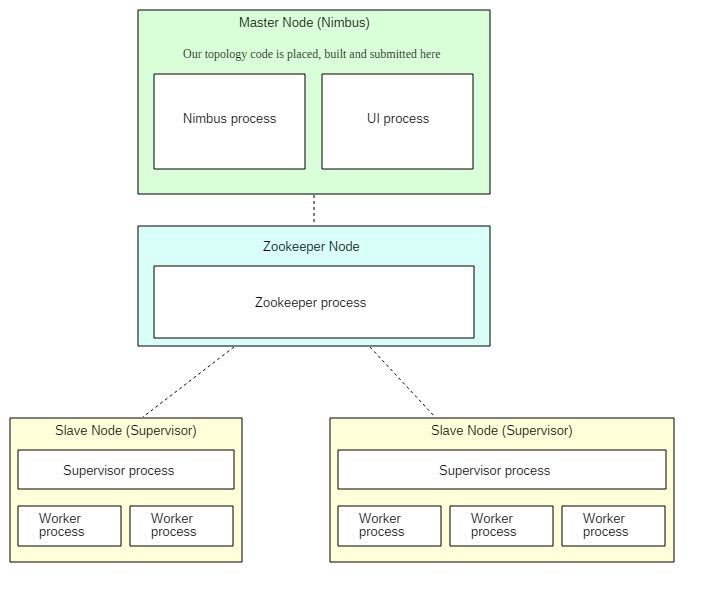
The Storm UI is a web interface used to manage the state of our cluster. We’ll get to this later.
Our topology is submitted to the Nimbus daemon on the primary node, and then distributed among the worker processes running on the replica/supervisor nodes. Thanks to Zookeeper, it doesn’t matter how many replica/supervisor nodes you run initially, as you can always seamlessly add more. Storm will automatically integrate them into the cluster.
Whenever we start a Supervisor, it allocates a certain number of worker processes (that we can configure). These can then be used by the submitted topology. So in the image above, there are a total of five allocated workers.
Remember this line: conf.setNumWorkers(5)
This means that the topology will try to use a total of five workers. And since our two Supervisor nodes have a total of five allocated workers, each of the 5 allocated worker processes will run one instance of the topology.
If we had run conf.setNumWorkers(4) then one worker process would have remained idle/unused. If the number of specified workers was six and the total allocated workers were five, then because of the limitation only five actual topology workers would’ve been functional.
Before we set this all up using Docker, there are a few important things to keep in mind regarding fault-tolerance:
- If any worker on any replica node dies, the Supervisor daemon will have it restarted. If restarting repeatedly fails, the worker will be reassigned to another machine.
- If an entire replica node dies, its share of the work will be given to another supervisor/replica node.
- If the Nimbus goes down, the workers will remain unaffected. However, until the Nimbus is restored, workers won’t be reassigned to other replica nodes if, say, their node crashes.
- The Nimbus and Supervisors are themselves stateless. But with Zookeeper, some state information is stored so that things can begin where they were left off if a node crashes or a daemon dies unexpectedly.
- Nimbus, Supervisor and Zookeeper daemons are all fail-fast. This means that they themselves are not very tolerant to unexpected errors, and will shut down if they encounter one. For this reason they have to be run under supervision using a watchdog program that monitors them constantly and restarts them automatically if they ever crash. Supervisord is probably the most popular option for this (not to be confused with the Storm Supervisor daemon).
Note: In most Storm clusters, the Nimbus itself is never deployed as a single instance but as a cluster. If this fault-tolerance is not incorporated and our sole Nimbus goes down, we’ll lose the ability to submit new topologies, gracefully kill running topologies, reassign work to other Supervisor nodes if one crashes, and so on.
For simplicity, our illustrative cluster will use a single instance. Similarly, the Zookeeper is very often deployed as a cluster but we’ll use just one.
Dockerizing The Cluster
Launching individual containers and all that goes along with them can be cumbersome, so I prefer to use Docker Compose.
We’ll be going with one Zookeeper node, one Nimbus node, and one Supervisor node initially. They’ll be defined as Compose services, all corresponding to one container each at the beginning.
Later on, I’ll use Compose scaling to add another Supervisor node (container). Here’s the entire code and the project structure:
zookeeper/ Dockerfilestorm-nimbus/ Dockerfile storm.yaml code/ pom.xml src/ jvm/ coincident_hashtags/ ExclamationTopology.java storm-supervisor/ Dockerfile storm.yamldocker-compose.ymlAnd our docker-compose.yml:
Feel free to explore the Dockerfiles. They basically just install the dependencies (Java 8, Storm, Maven, Zookeeper) on the relevant containers.
The storm.yaml files override certain default configurations for the Storm installations. The line ADD storm.yaml /conf inside the Nimbus and Supervisor Dockerfiles puts them inside the containers where Storm can read them.
storm-nimbus/storm.yaml:
storm-supervisor/storm.yaml:
These options are adequate for our cluster. If you are curious, you can check out all the default configurations here.
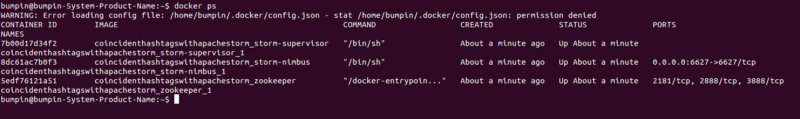
Run docker-compose up at the project root.
After all the images have been built and all the service started, open a new terminal, type docker ps and you’ll see something like this:
Starting The Nimbus
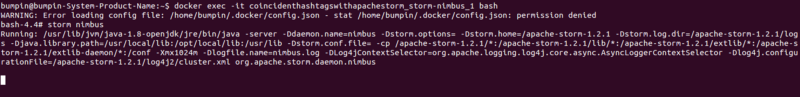
Let’s SSH into the Nimbus container using its name:
docker exec -it coincidenthashtagswithapachestorm_storm-nimbus_1 bash
And then start the Nimbus daemon: storm nimbus
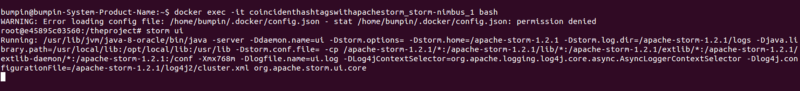
Starting The Storm UI
Similarly, open another terminal, SSH into the Nimbus again and launch the UI using storm ui:
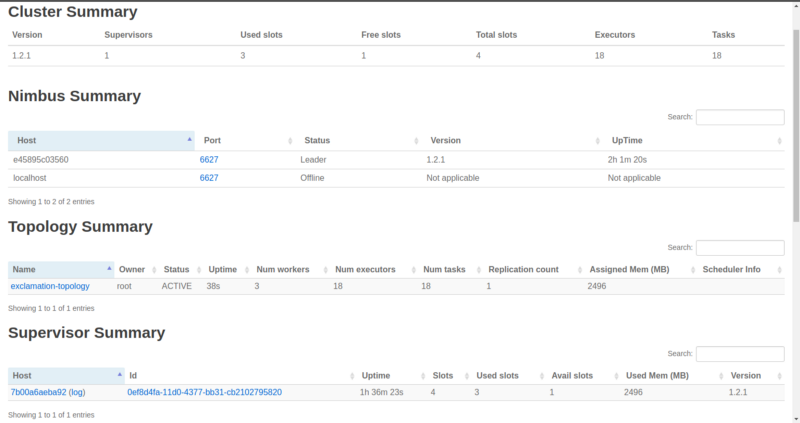
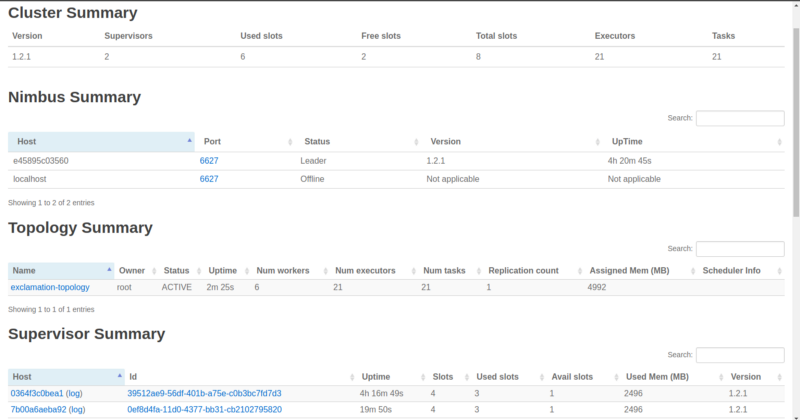
Go to localhost:8080 on your browser and you’ll see a nice overview of our cluster:
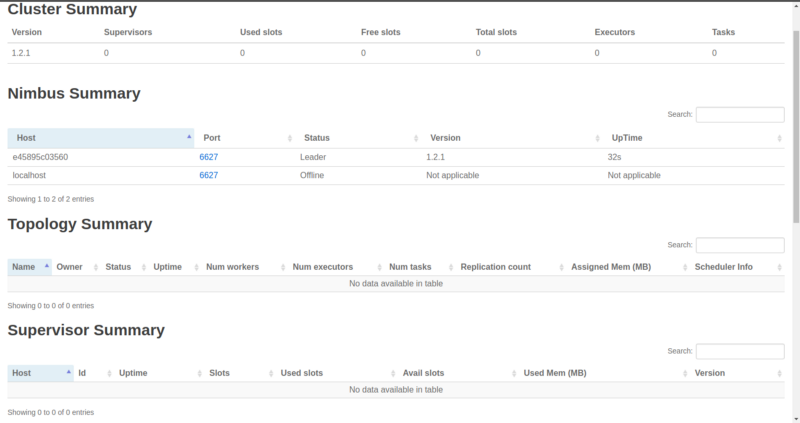
The ‘Free slots’ in the Cluster Summary indicate how many total workers (on all Supervisor nodes) are available and waiting for a topology to consume them.
‘Used slots’ indicates how many of the total are currently busy with a topology. Since we haven’t launched any Supervisors yet, they’re both zero. We’ll get to Executors and Tasks later. Also, as we can see, no topologies have been submitted yet.
Starting A Supervisor Node
SSH into the one Supervisor container and launch the Supervisor daemon:
docker exec -it coincidenthashtagswithapachestorm_storm-supervisor_1 bashstorm supervisor 
Now let’s go refresh our UI:
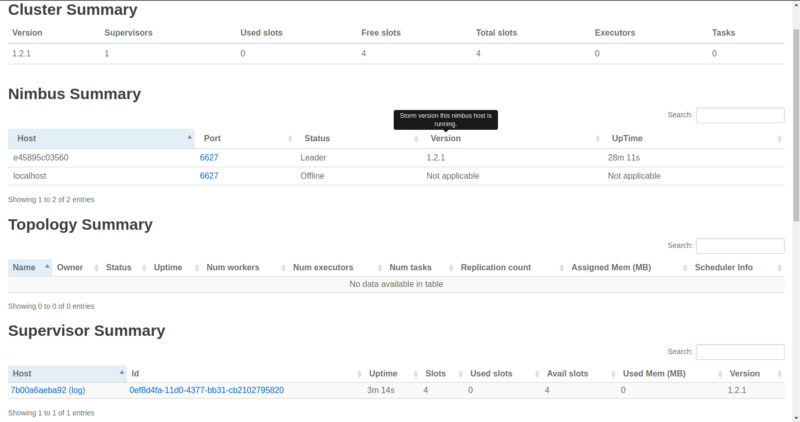
Note: Any changes in our cluster may take a few seconds to reflect on the UI.
We have a new running Supervisor which comes with four allocated workers. These four workers are the result of specifying four ports in our storm.yaml for the Supervisor node. Of course, they’re all free (four Free slots).
Let’s submit a topology to the Nimbus and put ’em to work.
Submitting A Topology To The Nimbus
SSH into the Nimbus on a new terminal. I’ve written the Dockerfile so that we land on our working (landing) directory /theproject. Inside this is code, where our topology resides.
Our topology is pretty simple. It uses a spout that generates random words and a bolt that just appends three exclamation marks (!!!) to the words. Two of these bolts are added back-to-back, and so at the end of the stream we’ll get words with six exclamation marks. It also specifies that it needs three workers (conf.setNumWorkers(3)).
Run these commands:
1. cd code
2. mvn clean
3. mvn package
4. storm jar target/coincident-hashtags-1.2.1.jar coincident_hashtags.ExclamationTopology
After the topology has been submitted successfully, refresh the UI:
As soon as we submitted the topology, the Zookeeper was notified. The Zookeeper in turn notified the Supervisor to download the code from the Nimbus. We now see our topology along with its three occupied workers, leaving just one free.
And ten word spout threads + three exclaim1 bolt threads + two exclaim bolt threads + the three main threads from the workers = total of 18 executors.
And you might’ve noticed something new: tasks.
What are tasks?
Tasks are another concept in Storm’s parallelism. But don’t sweat it, a task is just an instance of a spout or bolt that an executor uses. They are what actually does the processing.
By default, the number of tasks is equal to the number of executors. In rare cases you might need each executor to instantiate more tasks.
// Each of the two executors (threads) of this bolt will instantiate// two objects of this bolt (total 4 bolt objects/tasks).builder.setBolt(“even-digit-bolt”, new EvenDigitBolt(), 2) .setNumTasks(4) .shuffleGrouping(“random-digit-spout”);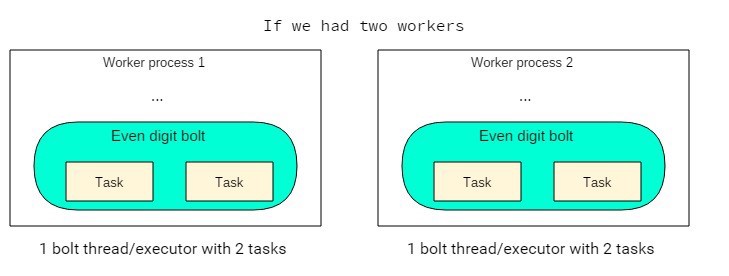
This is a shortcoming on my part, but I can’t think of a good use case where we’d need multiple tasks per executor.
Maybe if we were adding some parallelism ourselves, like spawning a new thread within the bolt to handle a long running task, then the main executor thread won’t block and will be able to continue processing using the other bolt.
However, this can make our topology hard to understand. If anyone knows of scenarios where the performance gain from multiple tasks outweighs the added complexity, please post a comment.
Anyways, returning from that slight detour, let’s see an overview of our topology. Click on the name under Topology Summary and scroll down to Worker Resources:
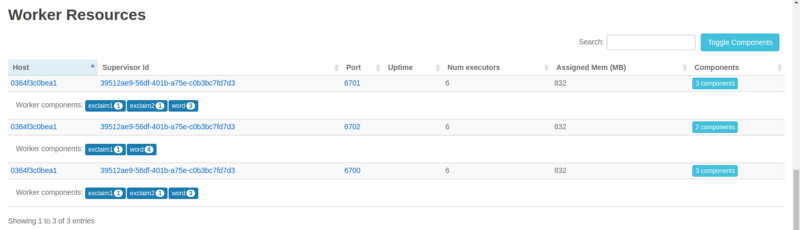
We can clearly see the division of our executors (threads) among the three workers. And of course all the three workers are on the same, single Supervisor node we’re running.
Now, let’s say scale out!
Add Another Supervisor
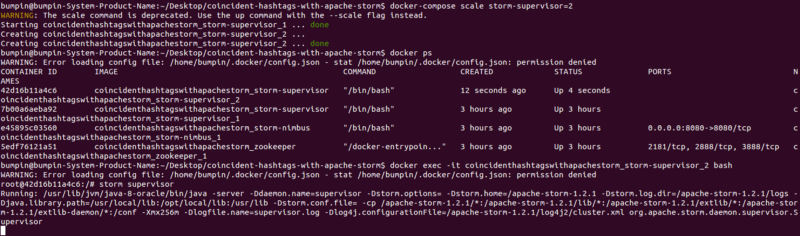
From the project root, let’s add another Supervisor node/container:
docker-compose scale storm-supervisor=2SSH into the new container:
docker exec -it coincidenthashtagswithapachestorm_storm-supervisor_2 bashAnd fire up: storm supervisor
If you refresh the UI you’ll see that we’ve successfully added another Supervisor and four more workers (total of eight workers/slots). To really take advantage of the new Supervisor, let’s increase the topology’s workers.
- First kill the running one:
storm kill exclamation-topology - Change this line to:
conf.setNumWorkers(6) - Change the project version number in your
pom.xml. Try using a proper scheme, like semantic versioning. I’ll just stick with 1.2.1. - Rebuild the topology:
mvn package - Resubmit it:
storm jar target/coincident-hashtags-1.2.1.jar coincident_hashtags.ExclamationTopology
Reload the UI:
You can now see the new Supervisor and the six busy workers out of a total of eight available ones.
Also important to note is that the six busy ones have been equally divided among the two Supervisors. Again, click the topology name and scroll down.
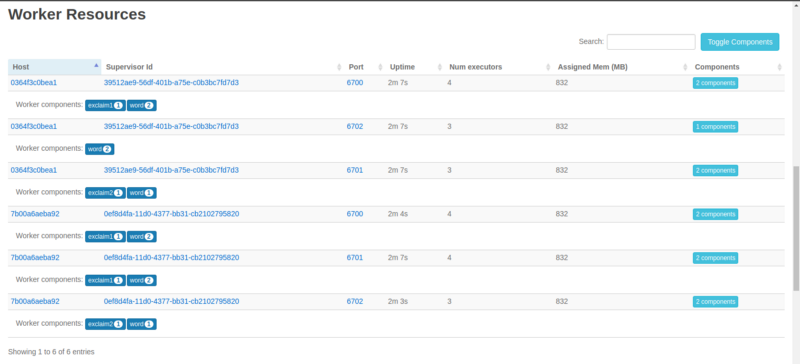
We see two unique Supervisor IDs, both running on different nodes, and all our executors pretty evenly divided among them. This is great.
But Storm comes with another nifty way of doing so while the topology is running — rebalancing.
On the Nimbus we’d run:
storm rebalance exclamation-topology -n 6Or to change the number of executors for a particular component:
storm rebalance exclamation-topology -e even-digit-bolt=3Reliable Message Processing
One question we haven’t tackled is about what happens if a bolt fails to process a tuple.
Storm provides us a mechanism by which the originating spout (specifically, the task) can replay the failed tuple. This processing guarantee doesn’t just happen by itself. It’s a conscious design choice, and does add latency.
Spouts send out tuples to bolts, which emit tuples derived from the input tuples to other bolts and so on. That one original tuple spurs an entire tree of tuples.
If any child tuple, so to speak, of the original one fails, then any remedial steps (rollbacks etc) may well have to be taken at multiple bolts. That could get pretty hairy, and so what Storm does is that it allows the original tuple to be emitted again right from the source (the spout).
Consequently, any operations performed by bolts that are a function of the incoming tuples should be idempotent.
A tuple is considered “fully processed” when every tuple in its tree has been processed, and every tuple has to be explicitly acknowledged by the bolts.
However, that’s not all. There’s another thing to be done explicitly: maintain a link between the original tuple and its child tuples. Storm will then be able to trace the origin of the child tuples and thus be able to replay the original tuple. This is called anchoring. And this has been done in our exclamation bolt:
// ExclamationBolt// ‘tuple’ is the original one received from the test word spout.// It’s been anchored to/with the tuple going out._collector.emit(tuple, new Values(exclamatedWord.toString()));// Explicitly acknowledge that the tuple has been processed._collector.ack(tuple);The ack call will result in the ack method on the spout being called, if it has been implemented.
So, say you’re reading the tuple data from some queue and you can only take it off the queue if the tuple has been fully processed. The ack method is where you’d do that.
You can also emit out tuples without anchoring:
_collector.emit(new Values(exclamatedWord.toString())) and forgo reliability.
A tuple can fail two ways:
- A bolt dies and a tuple times out. Or, it times out for some other reason. The timeout is 30 seconds by default and can be changed using
config.put(Config.TOPOLOGY_MESSAGE_TIMEOUT_SECS, 60) - The
failmethod is explicitly called on the tuple in a bolt:_collector.fail(tuple). You may do this in case of an exception.
In both these cases, the fail method on the spout will be called, if it is implemented. And if we want the tuple to be replayed, it would have to be done explicitly in the fail method by calling emit, just like in nextTuple(). When tracking tuples, every one has to be acked or failed. Otherwise, the topology will eventually run out of memory.
It’s also important to know that you have to do all of this yourself when writing custom spouts and bolts. But the Storm core can help. For example, a bolt implementing BaseBasicBolt does acking automatically. Or built-in spouts for popular data sources like Kafka take care of queuing and replay logic after acknowledgment and failure.
Parting Shots
Designing a Storm topology or cluster is always about tweaking the various knobs we have and settling where the result seems optimal.
There are a few things that’ll help in this process, like using a configuration file to read parallelism hints, number of workers, and so on so you don’t have to edit and recompile your code repeatedly.
Define your bolts logically, one per indivisible task, and keep them light and efficient. Similarly, your spouts’ nextTuple() methods should be optimized.
Use the Storm UI effectively. By default, it doesn’t show us the complete picture, only 5% of the total tuples emitted. To monitor all of them, use config.setStatsSampleRate(1.0d).
Keep an eye on the Acks and Latency values for individual bolts and topologies via the UI. That’s what you want to look at when tuning the parameters.