
by Shukant Pal
A full overview of HTML Canvas
A must read before doing anything with the canvas tag, even if you know it already.
Overview
The HTML canvas element is used to draw “raster” graphics on a web application. The Canvas API provides two drawing contexts: 2D and 3D, and in this guide, we’re going to talk about the 2D one (which I’ll refer it to the Canvas API for simplicity).
Before I get started, I want you to know one very important point. Canvas is a raster graphics API — you manipulate stuff at the pixel level. That means the underlying software does not know the model you are using to display your context — it doesn’t know if you’re drawing a rectangle or a circle.
I’ve divided the Canvas API in separate chunks, for you to gobble one by one:
- Path API
- Drawing Styles
- Gradients and Patterns
- Direct pixel manipulation & Images
- Transformations
- Hit Regions
- State and the clip() method
Setup
To fire up your Canvas tutorial, create an HTML file and a JS file linked to it.
<!DOCTYPE html>
<html>
    <head><title>Canvas Demo</title></head>
    <body>
        <canvas id="canvas-demo" width="400" height="400">
             This will be displayed if your browser doesn't
             support the canvas element. The closing tag is
             necessary.
        </canvas>
        <script src="canvas-demo.js"></script>
    </body>
</html>
In your canvas-demo.js file,
// canvas-demo.js

const demoCanvas = document.getElementById(’canvas-demo’).getContext(’2d’);

window.onload = function() {// make sure to use onload

/* Add code here as we go!!! @nodocs
 */

}
Paths
Paths are a collection of points in the 2D pixel grid in the canvas. They are drawn with the help of this API. Each shape in a path that you draw is called a “subpath” by the W3C documentation.
beginPath()andclosePath(): All the shapes that you draw are added into the current path. If you callstrokeorfilllater on, it will apply that to all of the shapes you’ve drawn in the current path. To prevent that, you divide your drawing by callingbeginPathandclosePath.
// Calling this isn't necessary, but a good practice.
demoCanvas.beginPath();

/*
 * Drawing code, copy and paste each example (separately) here
 */

demoCanvas.closePath();// this is required if you want to draw
// in a separate path latermoveTo(x,y): The signifies the construction of a new shape which starts at the point (x, y).lineTo(x,y): Draws a line from the last point in the current shape to the passed point. If no shaped was created (viamoveTo), then a new one is created starting at (x, y) (just likemoveTo).quadraticCurveTo(cpx1,cpy1,x,y)andbezierCurveTo(cpx1,cpy1,cpx2,cpy2,x,y): Draws a quadratic/cubic bezier curve starting from the last point in the shape, passing through the control points (cpx1,cpy1andcpx2,cpy2), and ending atx,y. A Bezier curve is just a “smooth” curve that passes through intermediate “control” points with given ending points. Note that the curve doesn’t have to exactly passe through the control points — it can be smoothed out.arcTo(x1,y1,x2,y2,radius): This is a slightly complicated method to use. Suppose the current point in the path isx0,y0— thenarcTowill draw an arc that has two tangents connecting these two pairs of points(x1,y1) & (x0,y0)and(x1,y1) & (x2,y2). The arc’s radius will be the one given. The greater the radius, the farther out the arc will be fromx1,y1, (See Example 1.2 for visual clarity). If you haven’t usedmoveToyet, thenx0,y0will by default be0,0.arc(x,y,radius,startAngle,endAngle,counterclockwise): The connects the current point in the path (by default0,0) to the beginning of the arc. It draws the arc from the centerx,yof radiusradius, fromstartAngletoendAngle. (Note: Unlike pen & paper mathematics, angles are described in the clockwise direction in the Canvas API); but in under four special conditions —(x0,y0)equals(x1,y1),(x1,y1)equals(x2,y2),(x0,y0),(x1,y1),(x2,y2)are collinear, or ifradiusis zero, then the call toarcwill be equivalent tolineTo(x1,y1)and a line will be drawn instead.rect(x,y,w,h): Draws a rectangle with the top-left cornerx,yand of widthwand heighth.
Example 1.1:
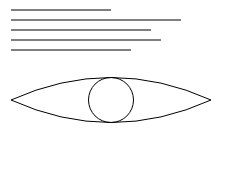
Now we need to try a demo — we are going to draw a few random horizontal lines and then a sketch of an eye. The result will look like something on the left. Don’t forget to go through the code and tinker with the code.
/* Draw horizontal subpaths (shapes) in one path. */

// Draw a pattern of vertically stack horizontal
// lines.
demoCanvas.moveTo(10, 10);// start at (10,10)
demoCanvas.lineTo(110, 10);
demoCanvas.moveTo(10, 20);// 10 pts below
demoCanvas.lineTo(180, 20);
demoCanvas.moveTo(10, 30);
demoCanvas.lineTo(150, 30);
demoCanvas.moveTo(10, 40);
demoCanvas.lineTo(160, 40);
demoCanvas.moveTo(10, 50);
demoCanvas.lineTo(130, 50);

// try removing this moveTo, the quad-curve will then
// start from from (130, 50), due to the lineTo.
demoCanvas.moveTo(10, 100);// quad-curve starts from here
demoCanvas.quadraticCurveTo(110, 55, 210, 100);// curve upward
demoCanvas.moveTo(10, 100);// back here, let's draw one below
demoCanvas.quadraticCurveTo(110, 145, 210, 100);// curve below
// that forms the eye outline

demoCanvas.moveTo(132.5, 100);// remove this, a horizontal line will be
// drawn from (210, 100) to (132.5, 100) because arc() connects the last
// point to the start of the arc.

demoCanvas.arc(110, 100, 22.5, 0, 2*Math.PI, false);// pupil (circle)

/* We'll talk about this shortly */
demoCanvas.stroke();// draws (by outlining our shapes in the path)
Example 1.2:
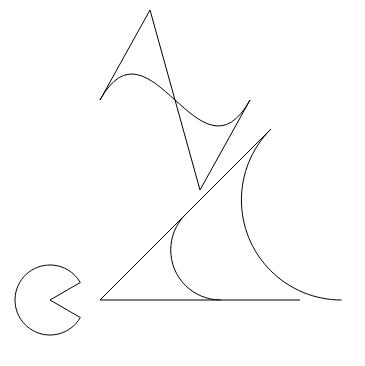
In the example below, I create a cubic curve (with visual guidelines), arcTocalls in the middle right, and a pack-man with arc() on bottom left. The control points (in the cubic curve) are the corners forms by the three guidelines.
(x1,y1) for arcTo is the corner formed by the two tangents.
// comment this block out if you can see the cubic curve
demoCanvas.moveTo(100, 100);
demoCanvas.lineTo(150, 10);
demoCanvas.moveTo(250, 100);
demoCanvas.lineTo(200, 190);
demoCanvas.moveTo(150, 10);
demoCanvas.lineTo(200, 190)

demoCanvas.moveTo(100, 100);
demoCanvas.bezierCurveTo(150, 10, 200, 190, 250, 100);

// arcTo() is too complicated to use
// demoCanvas.stroke(); demoCanvas.closePath(); demoCanvas.beginPath();
demoCanvas.moveTo(200, 200);// comment out above line (and comment this line),
// then the arc's tangent will come from (0,0)!! Try it.

demoCanvas.arcTo(100, 300, 300, 300, 100);
demoCanvas.moveTo(200, 200);
demoCanvas.arcTo(100, 300, 300, 300, 50);

demoCanvas.moveTo(100, 300);
demoCanvas.lineTo(300, 300);
demoCanvas.moveTo(100, 300);
demoCanvas.lineTo(200, 200);

demoCanvas.moveTo(50, 300);
// packman
demoCanvas.arc(50, 300, 35, Math.PI/6, 11*Math.PI/6, false);
demoCanvas.lineTo(50, 300);

demoCanvas.stroke();
Drawing styles
Till now, we have been drawing simple thin-lined paths. Drawing styles will help us make our drawing much better.
Note that you cannot apply two different styles on the same path. For example, if you want to draw a red line and a blue line — you will have to create a new path to draw the blue one. If you don’t create a new path, then on calling stroke the 2nd time after setting your display style color to blue, both lines will be colored blue. Hence, styles are applied to all subpaths, whether or not they have been stroked already.
A few properties of the 2D context object demoCanvas are defined for this purpose:
lineWidth: The thickness of the lines being drawn. By default, this is 1; hence, the two examples above used a 1-pixel thick outline.lineCap: This is the cap applied at the ends of subpaths (shapes). It is a string and can have three valid values: “butt”, “round”, “square” (See Example 1.3 for visual clarity). “butt” will end lines with no cap — resulting in rigid, orthogonal ends like thin rectangles. “round” adds a semi-circle to the ends to give smooth ends. “square” adds a square to the end, but it looks like “butt”. “round” and “square” add bit of extra length to each subpath.lineJoin: This decides how two overlapping lines are joined. For example, if you want to create a right-hand arrow (>), then you can change how the corner is formed with this property. This has three valid values: “round”, “bevel” and “miter”. Check Example 1.4 for how they change the corners. (The default value is “miter”). “round” will form circular corners, while “bevel” will create rigid three-sided corners, and “miter” will form a sharp edge.miterLimit: WhenlineJoin="miter", this decides the maximum distance b/w the inner and outer corner of the line. See Example 1.4(b) for visual clarity. If the miter-limit is too high, then sharp arrows may have a large common area b/w the two lines. If miter-limit is passed, then the display backs into a bevel join.
Example 1.3 & 1.4:
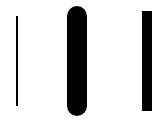
In Example 1.3 on the left, you can see how the round & square line-capped lines are longer than the default capping. (NOTE: The thicker the line, the greater the increase in length)
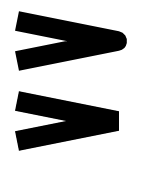
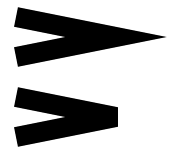
In Example 1.4(a), you can see how round and bevel joins work. The lines created are identical in the upper and lower parts. Only the lineJoinproperties are different.
In Example 4.1(b), you can see how a mitered join works, and what happens if the mitered length is passed.
Additional display style properties are defined:
font: This string defines how you want to style text. For example,demoCanvas.font="10px Times New Roman"is a valid font value.textAlign: The valid values are — “start”, “end”, “left”, “right”, and “center”. The default is “start”.textBaseline: The valid values are — “top”, “hanging”, “middle”, “alphabetic”, “ideographic”, “bottom”. The default is “alphabetic”.
Actual drawing methods
In the examples till now, you might have noticed I’ve used demoCanvas.stroke() before closing each path. The stroke method does that actual drawing partly in those examples.
stroke: This method draws the outline around each subpath (shapes) according to thelineWidthand related properties.fill: This method fills the interior of the shape traced by the path. If the path is not closed, then it will close it automatically by connecting the last point to the first point.
demoCanvas.moveTo(10,10);
demoCanvas.lineTo(50, 50);
demoCanvas.lineTo(10, 50);
demoCanvas.fill();
The above code does not close the triangle (10,10),(50,50),(10,50) but calling fill() fills it as expected.

clearRect(x,y,w,h): Clears the pixels in the rectangle formed with the given parameters.strokeRect(x,y,w,h): Equivalent to callingrectand thenstroke. It doesn’t add the rectangle to the current path — hence, you can change the style later and callstrokewithout affecting the rectangle formed.fillRect(x,y,w,h): Equivalent to callingrectand thenfill. This also doesn’t add the rectangle to the current path.strokeText(text,x,y,maxWidth)andfillText(text,x,y,maxWidth): Writes the text at (x,y) according to thestrokeStyle/fillStyleproperty.maxWidthis optional and defines the maximum length in pixels that you want the text to occupy. If the text is longer, then it is scaled to a smaller font.measureText("text").widthcan be used to find the display width of a piece of text, based on the currentfont.
NOTE: fillStyle and strokeStyle are the properties that can be set to any CSS color string to set the fill & stroke colors.
Gradients and Patterns
Out of the box, the 2D context provides linear and radial gradients. The createLinearGradient and createRadialGradient methods return CanvasGradient objects, which can then be modified what we want.
createLinearGradient(x0,y0,x1,y1): Constructs a linear gradient that runs on the linex0,y0tox1,y1.createRadialGradient(x0,y0,r0,x1,y1,r1): Constructs a radial gradient that runs in the cone (of circles) with the top (inner circle) of radiusr0and bottom (outer circle) of radiusr1. The first color would have a radius ofr0.
The CanvasGradient has one method: addColorStop(offset,color) . The gradient starts at 0 and ends at 1. The color at the position of offset will be set using this method. For example, addColorStop(.5, "green") will make the middle color green. Colors b/w two adjacent stops will be interpolated (mixed).
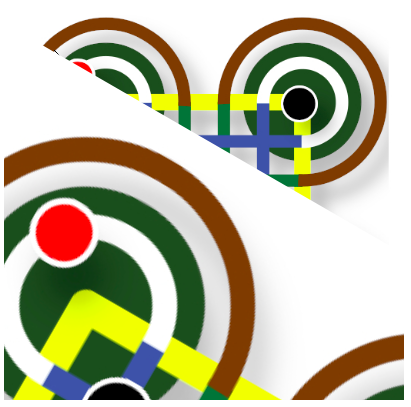
Example 1.6:
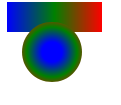
In the example on the left, you can see how linear and radial gradients work.
var linearGrad = demoCanvas.createLinearGradient(5,5,100,5);
linearGrad.addColorStop(0, "blue");
linearGrad.addColorStop(.5, "green");
linearGrad.addColorStop(1, "red");
demoCanvas.strokeStyle=linearGrad;
demoCanvas.lineWidth=50;
demoCanvas.moveTo(5,5);
demoCanvas.lineTo(100,5);
demoCanvas.stroke();// change strokeStyle(l10) to fillStyle(l10)
// and stroke() to fill(). Then, change lineTo(100,5) to rect(5,5,95,50).
// Results should be almost same.
demoCanvas.closePath();
demoCanvas.beginPath();
var radialGrad = demoCanvas.createRadialGradient(50,50,10,50,50,40);
radialGrad.addColorStop(0, "blue");
radialGrad.addColorStop(.5, "green");
radialGrad.addColorStop(1, "red");
demoCanvas.fillStyle=radialGrad;
demoCanvas.arc(50,50,30,0,2*Math.PI,false);
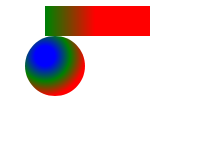
demoCanvas.fill();You might wonder what if x0,y0 and x1,y1 given to the linear/radial gradient are not equal to the line/arc we create? See Example 1.7
Example 1.7
var linearGrad = demoCanvas.createLinearGradient(5,5,100,5);
linearGrad.addColorStop(0, "blue");
linearGrad.addColorStop(.5, "green");
linearGrad.addColorStop(1, "red");
demoCanvas.strokeStyle=linearGrad;
demoCanvas.lineWidth=50;
demoCanvas.moveTo(50,5);
demoCanvas.lineTo(155,5);
demoCanvas.stroke();// change strokeStyle(l10) to fillStyle(l10)
// and stroke() to fill(). Then, change lineTo(100,5) to rect(5,5,95,50).
// Results should be almost same.

demoCanvas.closePath();
demoCanvas.beginPath();
var radialGrad = demoCanvas.createRadialGradient(50,50,10,50,50,40);
radialGrad.addColorStop(0, "blue");
radialGrad.addColorStop(.5, "green");
radialGrad.addColorStop(1, "red");
demoCanvas.fillStyle=radialGrad;
demoCanvas.arc(60,60,30,0,2*Math.PI,false);
demoCanvas.fill();
Direct pixel manipulation & Images
The ImageData object can be used to manipulate individual pixels. It has three properties:
width: The width of the image data in device-display pixels.height: The height of the image data in device-display pixels.data: This is aUint8ClampedArray(MDN doc here) which contains the individual pixel data in a series of (R,G,B,A) bytes for the top-most pixel to the bottom-right pixel. So the nth pixel’s red value would be atdata[y*width+x], green would be atdata[y*width+x+1], blue would be atdata[y*width+x+2], and the alpha would be atdata[y*width+x+3].
NOTE: A RGBA value can be used to represent a color — where R,G,B are the amounts of red, green, and blue and A is the opacity (alpha value). In the Canvas, these elements can have any integer value in [0, 255].
You can get a ImageData object with the following methods in the Canvas API:
createImageData(sw,sh): This creates anImageDataobject of width and heightswandsh, defined in CSS pixels. All the pixels will be initialized to transparent black (hex R,G,B=0, and also A=0).
CSS pixels might map to a different number of actual device pixels exposed by the object itself
createImageData(data): Copies the given image-data and returns the copy.getImageData(sx,sy,sw,sh): Returns a copy of the canvas’s pixels in the rectangle formed bysx,sy,sw,shin aImageDataobject. Pixels outside the canvas are set to transparent black.putImageData(imagedata,dx,dy,dirtyX,dirtyY,dirtyWidth,dirtyHeight): (The last four ‘dirty’ arguments are optional). Copies the pixel values inimagedatainto the canvas rectangle atdx,dy. If you provide the last four arguments, it will only copy the dirty pixels in the image data (the rectangle formed atdirtyX,dirtyYof dimensionsdirtyWidth*dirtyHeight). Not passing the last four arguments is the same as callingputImageData(imagedata,dx,dy,0,0,imagedata.width,imagedata.height).
For all integer values of x and y where dirtyX ≤ x < dirtyX+dirtyWidth and dirtyY ≤ y < dirtyY+dirtyHeight, copy the four channels of the pixel with coordinate (x, y) in the imagedata data structure to the pixel with coordinate (dx+x, dy+y) in the underlying pixel data of the canvas.Example 1.8:
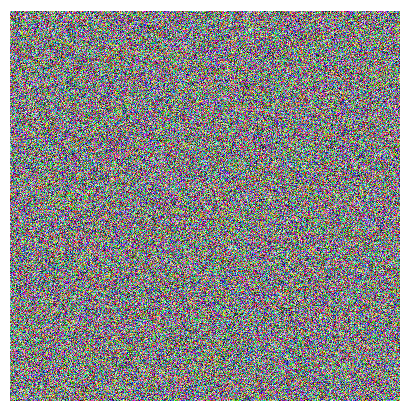
I’ve filled the whole 400x400 canvas with random colors (fully opaque) using the getImageData/putImageData methods.
Note that using beginPath/closePath isn’t necessary to use the ImageData API — because your not using the Canvas API to form shapes/curves.
/* replace this line with demoCanvas.createImageData(390,390) instead. */
var rectData = demoCanvas.getImageData(10, 10, 390, 390);

for (var y=0; y<390; y++) {
  for (var x=0; x<390; x++) {
    const offset = 4*(y*390+x);// 4* because each pixel is 4 bytes
    rectData.data[offset] = Math.floor(Math.random() * 256);// red
    rectData.data[offset+1] = Math.floor(Math.random() * 256);// green
    rectData.data[offset+2] = Math.floor(Math.random() * 256);// blue
    rectData.data[offset+3] = 255;// alpha, fully opaque
  }
}

demoCanvas.putImageData(rectData, 10, 10);

/* beginPath/closePath aren't required for this code */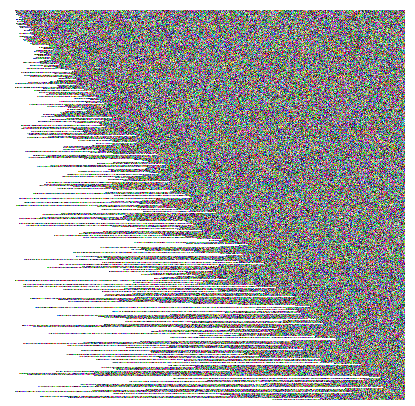
Images can be drawn onto the canvas directly. The drawImage can be used in three different ways to do so. It requires a CanvasImageSource as the pixel source.
ACanvasImageSourcecan be one of the following — HTMLImageElement, HTMLCanvasElement, HTMLVideoElement. To copy into the canvas, you can use a<img style="display:none;" src="..." />. You could also copy an existing canvas or the screenshot of a video!!!
drawImage(image,dx,dy): Copies the image-source into the canvas at (dx,dy). The whole image is copied.drawImage(image,dx,dy,dw,dh): Copies the image-source into the rectangle in the canvas at (dx,dy) of size (dw,dh). It will be scaled down or scaled up if necessary.drawImage(image,sx,sy,sw,sh,dx,dy,dw,dh): Copies the rectangle in the image sourcesx,sy,sw,shinto the rectangle in the canvasdx,dy,dw,dhand scales up or down if required. However, if the rectanglesx,sy,sw,shhas parts outside the actual source — then the source rectangle is clipped to include the inbound parts and the destination rectangle is clipped in the same proportion; however, you shouldn’t pass any out-of-bounds rectangle — keep it simple, stupid.
Example 1.9:
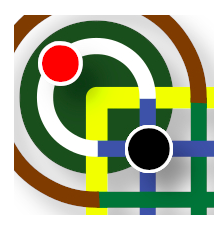
var image = document.getElementById('game-img');
demoCanvas.drawImage(image, 50, 50, 200, 200, 100, 100, 200, 200);

/* beginPath/closePath aren't required for this code */
NOTE: Add this to your HTML —
<img id="game-img" src="/path/to/your/image.ext" style="display:none" />Transformations
Now we’re getting to the exciting parts of the Canvas API!!!
The Canvas uses a transformation matrix to transform the input (x, y) coordinates into the displayed (x, y) coordinates. Note that pixels drawn before the transformation are not transformed — they are untouched. Only stuff drawn after applying the transformation will be changed.
There are three in-built transformation methods:
scale(xf,yf): This method scales the input byxfin the horizontal direction andyfin the vertical direction. If you want to magnify an image by a factor ofm, then passxf=yf=m. To stretch/squeeze an image horizontally bym,xf=m,yf=1. To stretch/squeeze an image vertically bym,xf=1,yf=m.rotate(angle): Rotates the input by an angle ofanglein the clockwise direction, in radians.translate(dx,dy): Shifts the input bydx,dy.
Example 2.0:
var image = document.getElementById('game-img');
demoCanvas.drawImage(image, 0, 0, 400, 400);
demoCanvas.rotate(Math.PI / 6);
demoCanvas.scale(2, 2);
demoCanvas.translate(10, 10);
demoCanvas.drawImage(image, 0, 0, 400, 400);
In Example 2.0, notice how the original image is intact. Only the second image (overlay) is transformed by three methods — rotate, scale, transform.
To revert all transformations:
demoCanvas.setTransform(1, 0, 0, 0, 0, 1);
// sets the transform to the identity matrix
NOTE:
- Changing the order of transformation can affect the final result.
- For advanced users, you may want to look at the
transformandsetTransformmethods. This will let you set the 3D transformation matrix directly. getImageDataandputImageDataare not affected by the transform. That means if you draw a black rectangle usingputImageData, it won’t be transformed (rotated/scaled/translated).- As changing the transform only works for drawings done after applying it, you can’t scale/rotate/translate the existing canvas directly (nor does
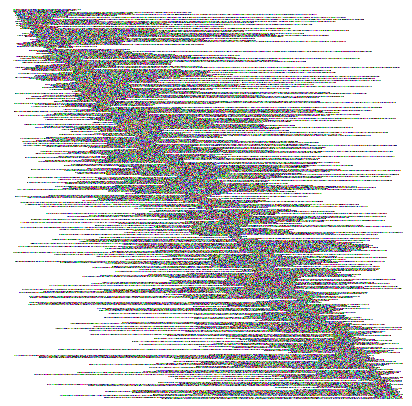
getImageDataand thenputImageDatawork). You may have to create another hidden canvas of the same size — and then copy the image-data into the 2nd canvas, then usedrawImageon the 2nd canvas. - Check this example: https://canvasdemo2d.github.io/ (source: https://github.com/canvasdemo2d/canvasdemo2d.github.io). Move your cursor over the canvas and see what it does. It won’t work on mobile phones, unfortunately. The cascading effect is due to the fact that I am translating the canvas w.r.t mouse using
drawImage.drawImagethen writes to the same canvas it’s reading from, which causes the repeating pattern!
Hit Regions
As of the time of writing (March 2019), support for hit regions is experimental in Chrome and on Firefox. Mobile browser don’t even support it at all. Hence, I will explain to you “what” could hit regions be used for.
Hit regions are used to catch pointer events on the canvas and know “where” the user clicked. For example, you could have two rectangles A & B — when the user clicks A, you want to perform action $A and when the user clicks B, you want to perform action $B. Let’s walk through the whole process!
A hit region is related to these three things:
- Path: The current path when the hit region was created (for example, a rectangle). All pointer events inside the path are routed to that hit region.
- Id: An unique id string to identify the hit region by the event handler.
- Control: An alternative DOM element (
HTMLButtonElement, for example) that gets the pointer events instead.
NOTE: The path is automatically provided by the canvas when adding a new hit region. Only one — id or control — is needed to form a hit region.
Methods for manipulating the hit-region list of a canvas are:
addHitRegion(options): Takes aHitRegionOptionsobject and forms a hit-region enclosed by the current path. Theoptionsargument should be a stringidproperty or aHTMLElementcontrolproperty.removeHitRegion(id): Removes the hit region with the ididso that it no longer receives any pointer events.clearHitRegions(): Removes all hit regions.
demoCanvas.fillStyle = 'red';
demoCanvas.rect(10,10,60,60);
demoCanvas.fill();// first rectangle
demoCanvas.addHitRegion({ id: 'btn1' });

demoCanvas.fillStyle = 'blue';
demoCanvas.rect(10,110,60,60);
demoCanvas.fill();
demoCanvas.addHitRegion({ id: 'btn2' });

document.getElementById('demo-canvas').onpointerdown = function(evt) {
// demoCanvas is the 2d context, not the HTMLCanvasElement

  console.log('Hello id: ' + evt.region);// region is hitregion id
}

// This code might not work due to this being an
// unsupported (new) feature of HTML5.
NOTE: Hit regions aren’t supported — but that doesn’t mean you have to use them to capture pointer events. You could create your “own hit-region list” and representations of boundaries of regions (cause you can’t get the current path from the canvas, too bad). In the document.getElementById('demo-canvas').onpointerdown method, get the current clientX,clientY properties and search through the hit region list. Based on the hit region that contains the point, you can perform the intended action.
States and the clip() method
State saving is a convenience provided by the W3C specification. You can save the current state of a canvas and restore it later.
You could also build such a system (partially) by writing your own JavaScript model. But you would have to save a quite of stuff: transformation matrix, hit-region list, style properties, and so on. Furthermore, you cannot revert the clipping area (we’ll get to the clipmethod in some time) directly.
NOTE: The save / restore methods do not save & restore the actual drawing/pixels. They only save other properties.
Hence, I would recommend heavily using the save & restore methods to go back and forth instead of erasing stuff on your own or making your own state-saving mechanism.
The CanvasRendering2DContext object has an associated state stack. The save method will push the current canvas state onto that stack, while the restore method will pop the latest state from the stack.
The Clipping Region
The clipping region is a specific region in which all drawings are to be done. Obviously, by default, the clipping region is the rectangle is the whole canvas. But you may want to draw in a specific region instead of the whole thing. For example, you may want to draw the lower half of a star formed by multiple lineTo methods.
So, for example, let’s say you know how to draw a star in the canvas. It touches all sides of the canvas. But now you want to only display the lower half of the star. In this scenario, you would:
- Save the state of the canvas
- Clip the lower half region
- Draw your star (as if on the whole canvas)
- Restore the canvas state
To clip a region, you have to call the clip() method which does the following:
Theclip()method must create a new clipping region by calculating the intersection of the current clipping region and the area described by the path, using the non-zero winding number rule. Open subpaths must be implicitly closed when computing the clipping region, without affecting the actual subpaths. The new clipping region replaces the current clipping region.
When the context is initialized, the clipping region must be set to the rectangle with the top left corner at (0,0) and the width and height of the coordinate space.
— W3C Documentation for Canvas 2D Context
demoCanvas.save();
demoCanvas.rect(0, 200, 400, 200);// lower-half rectangle subpath
demoCanvas.clip();
/* star drawing method */
demoCanvas.restore();
That’s all for now. I will write an article on animations with the canvas and how to write a custom interface completely on the canvas.
Further reading:
- How to use Firebase for building Android multiplayer games
- How to synchronize your game app across multiple Android devices
- Circular Dependencies in JavaScript
Shukant Pal is the creator of the Silcos kernel. He is an avid learner and is now practicing advanced web application development. He has hands-on experience with React and its ecosystem.
All quotations are taken from the W3C docs for Canvas 2D Context.
Hey, I’m Shukant Pal. I am developing a lot of web applications in my free time. Follow me on social media.