
by Robert Axelsen
Google Chrome might have broken your tests without you even knowing about it

My colleague just discovered that Chrome 58 (released April 19th) has silently muted all console.debug() output in their Chrome Dev Tools.
How? By making changes to the Console UI, from filtering based on type of console method to filtering based on levels.
Introducing levels is not a bad thing in and of itself. But Google also chose to stop showing all console output by default. Now you can only see level “Info” and below.
Depending on your project, it might also be a big deal to no longer be able to filter by showing only one console method’s output.
For example only console.log(). This is particularly troublesome if you’re working on a larger project with hundreds of different types of output mixed together.
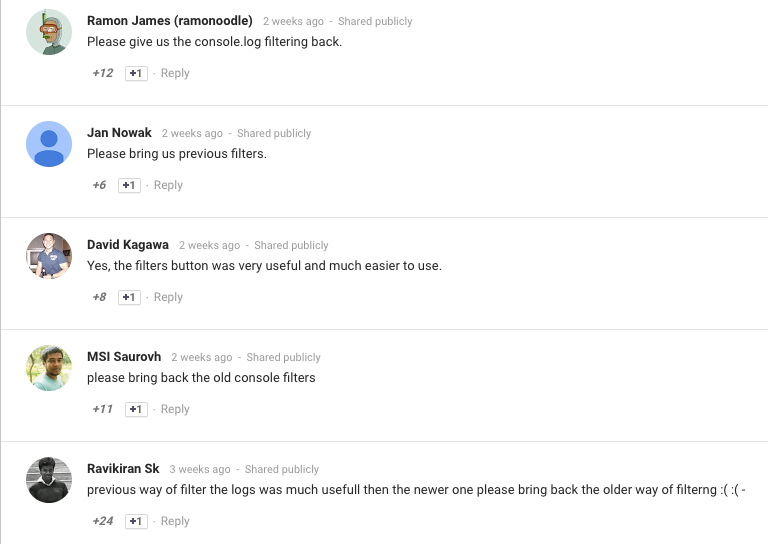
As you can see from the comments section in the release notes, this has not been received well by developers.
Failing Tests
This means that if your app or project relies on console.debug() level output for testing, your tests might have been failing for over a month without you even noticing.
All without so much as a pop-up warning from Google.
By making logging non-verbose by default, I believe Google has broken with best practice here, and made a huge mistake.
Also, removing the ability to only show output based on a specific console method has resulted in a worsened workflow for many developers.
Test it out for yourself
I did some testing with the following console methods in Chrome Dev Tools:
console.assert(true, {assert: "assert"});console.count('count');console.debug('debug');console.dir({dir: "dir"});console.error('error');console.info('info');console.log('log');console.profile('profile');setTimeout(function(){ console.profileEnd('profile'); }, 1000);console.table('table');console.time('time');setTimeout(function(){ console.timeEnd('time'); }, 1000);console.timeStamp('timeStamp');console.trace('trace');console.warn('warn');You can simply copy paste this into the console in Chrome Dev Tools, hit enter, and change the filter level to see what is displayed in which level.
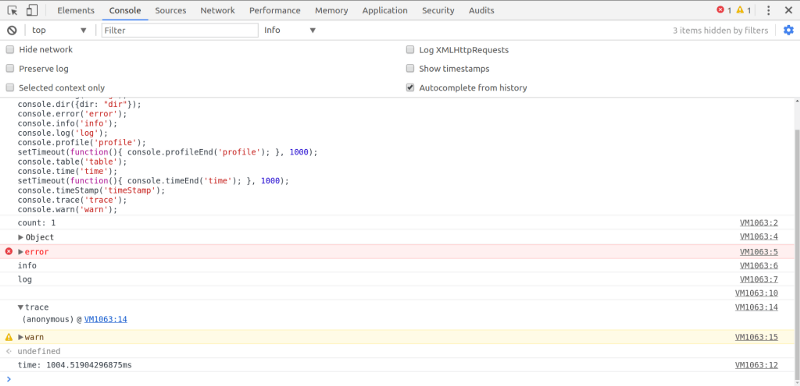
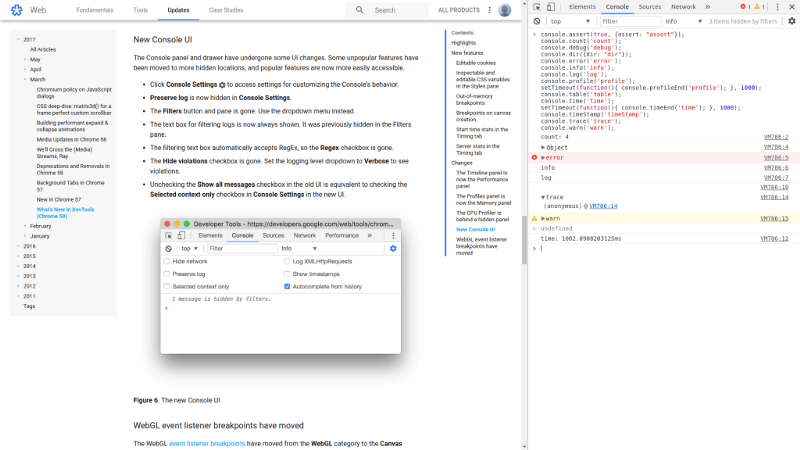
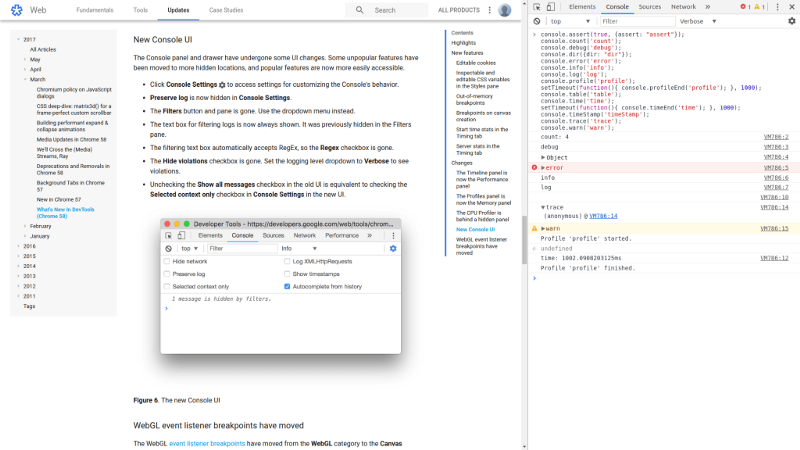
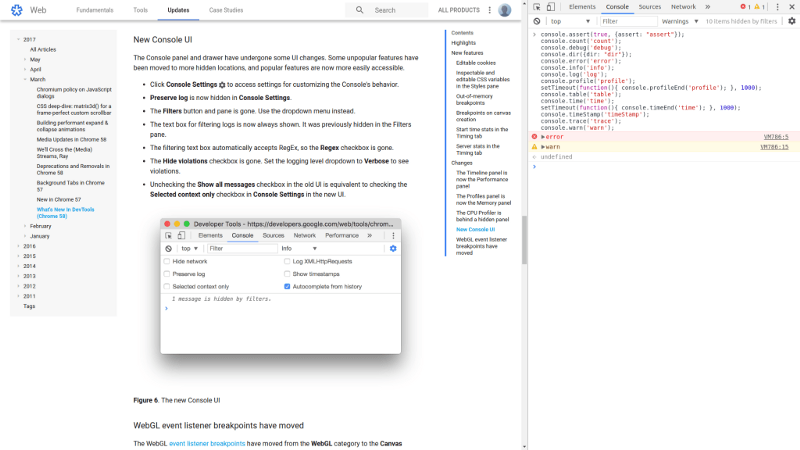
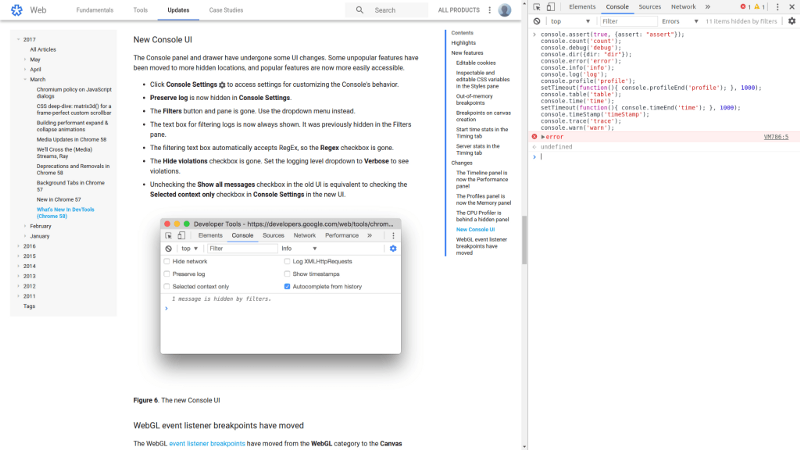
Some Screenshots To Illustrate
Here are some screenshots to illustrate the differences between levels. Notice especially the first screenshot of default “Info” level, and the fact that “3 items are hidden.”
Have Any Thoughts?
What do you think about this change? Was Google in the wrong for making this change? Or do you think it was an improvement to the “Console UI” overall? Please leave a comment below.
This article was originally published on “Hello, I Love Code” and is written by Robert Axelsen, who is a JavaScript Developer, Meetup Organizer and Open Source enthusiast based in Austria, Europe.
You can connect with Robert on Twitter, or get to know him better by visiting his website.