by Shubhi Asthana
How to get started with Databricks
When I started learning Spark with Pyspark, I came across the Databricks platform and explored it. This platform made it easy to setup an environment to run Spark dataframes and practice coding. This post contains some steps that can help you get started with Databricks.
Databricks is a platform that runs on top of Apache Spark. It conveniently has a Notebook systems setup. One can easily provision clusters in the cloud, and it also incorporates an integrated workspace for exploration and visualization.
You can also schedule any existing notebook or locally developed Spark code to go from prototype to production without re-engineering.
1. Setup a Databricks account
To get started with the tutorial, navigate to this link and select the free Community Edition to open your account. This option has single cluster with up to 6 GB free storage. It allows you to create a basic Notebook. You’ll need a valid email address to verify your account.
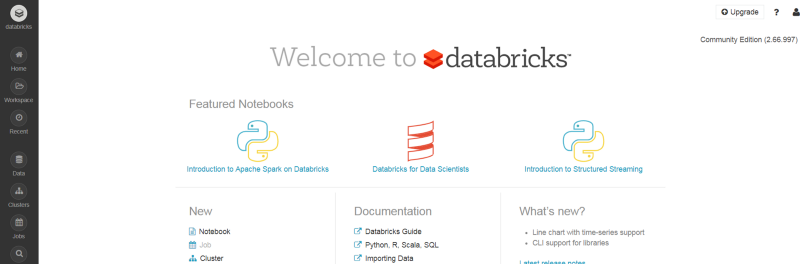
You will observe this screen once you successfully log in to your account.

2. Creating a new Cluster
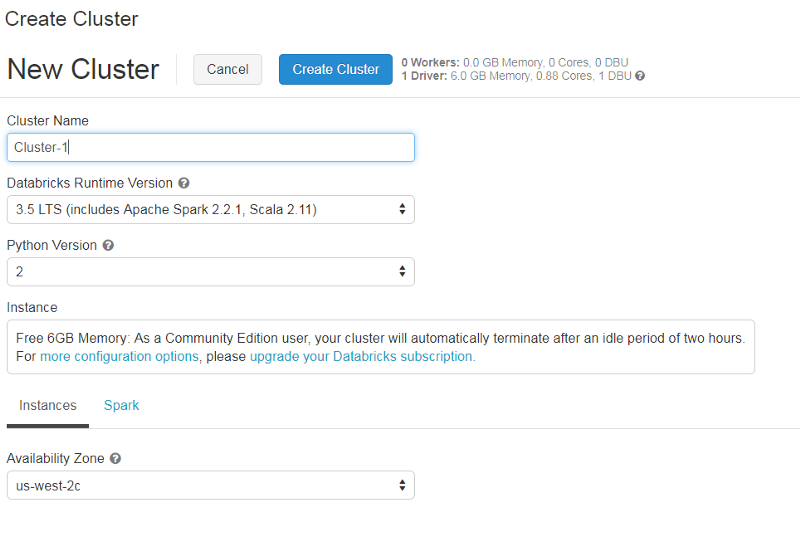
We start with creating a new cluster to run our programs on. Click on “Cluster” on the main page and type in a new name for the cluster.
Next, you need to select the “Databricks Runtime” version. Databricks Runtime is a set of core components that run on clusters managed by Databricks. It includes Apache Spark, but also adds a number of components and updates to improve the usability and performance of the tool.
You can select any Databricks Runtime version — I have selected 3.5 LTS (includes Apache Spark 2.2.1, Scala 2.11). You also have a choice between Python 2 and 3.
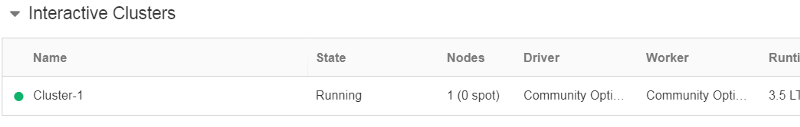
It’ll take a few minutes to create the cluster. After some time, you should be able to see an active cluster on the dashboard.
3. Creating a new Notebook
Let’s go ahead and create a new Notebook on which you can run your program.
From the main page, hit “New Notebook” and type in a name for the Notebook. Select the language of your choice — I chose Python here. You can see that Databricks supports multiple languages including Scala, R and SQL.
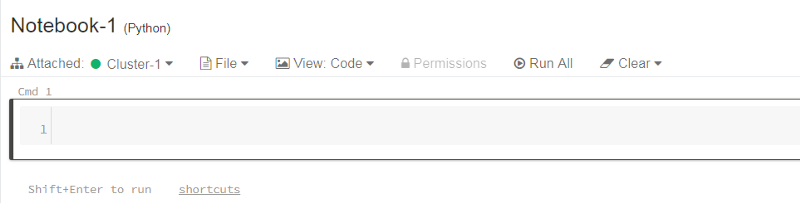
Once the details are entered, you will observe that the layout of the notebook is very similar to the Jupyter notebook. To test the notebook, let’s import pyspark.
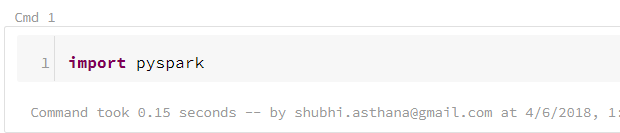
The command ran in 0.15 seconds and also gives the cluster name on which it is running. If there are any errors in the code, it would show below the cmd box.
You can hit the keyboard icon on the top right corner of the page to see operating system-specific shortcuts.
The most important shortcuts here are:
- Shift+Enter to run a cell
- Ctrl+Enter keeps running the same cell without moving to the next cell
Note these shortcuts are for Windows. You can check the OS-specific shortcuts for your OS on the keyboard icon.
4. Uploading data to Databricks
Head over to the “Tables” section on the left bar, and hit “Create Table.” You can upload a file, or connect to a Spark data source or some other database.
Let’s upload the commonly used iris dataset file here (if you don’t have the dataset, use this link )
Once you upload the data, create the table with a UI so you can visualize the table, and preview it on your cluster. As you can see, you can observe the attributes of the table. Spark will try to detect the datatype of each of the columns, and lets you edit it too.
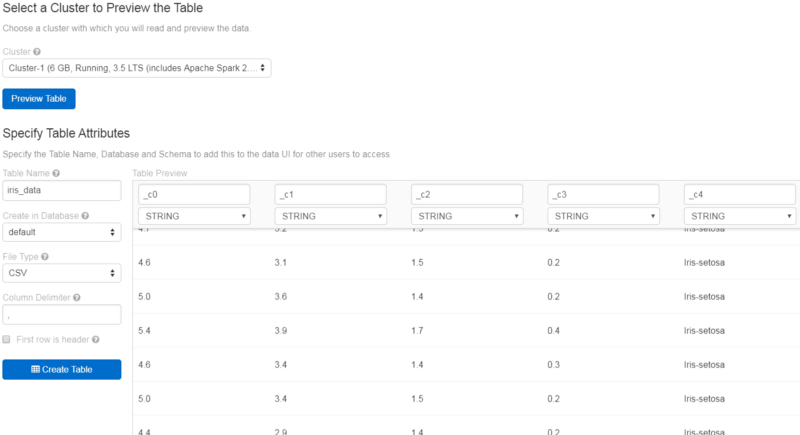
Now I need to put headers for the columns, so I can identify each column by their header instead of _c0, _c1 and so on.
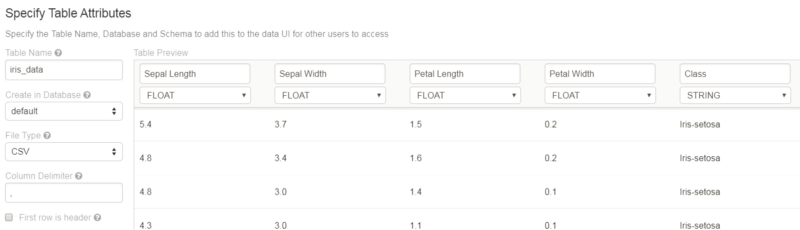
I put their headers as Sepal Length, Sepal Width, Petal Length, Petal Width and Class. Here, Spark detected the datatype of the first four columns incorrectly as a String, so I changed it to the desired datatype — Float.
5. How to access data from Notebook
Spark is a framework that can be used to analyze big data using SQL, machine learning, graph processing or real-time streaming analysis. We will be working with SparkSQL and Dataframes in this tutorial.
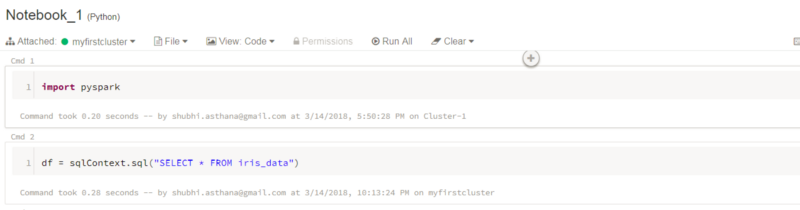
Let’s get started with working with the data on the Notebook. The data that we have uploaded is now put in tabular format.We require a SQL query to read the data and put it in a dataframe.
Type df = sqlContext.sql(“SELECT * FROM iris_data”) to read iris data into a dataframe.
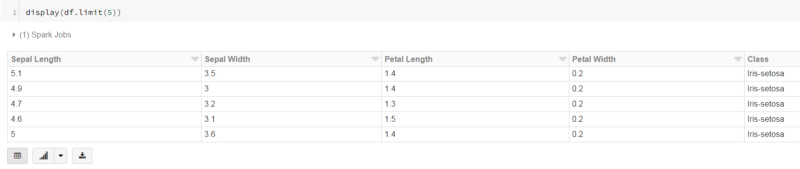
To view the first five rows in the dataframe, I can simply run the command:
display(df.limit(5))
Notice a Bar chart icon at the bottom. Once you click, you can view the data that you have imported into Databricks. To view the bar chart of complete data, rundisplay(df) instead of display(df.limit(5)).
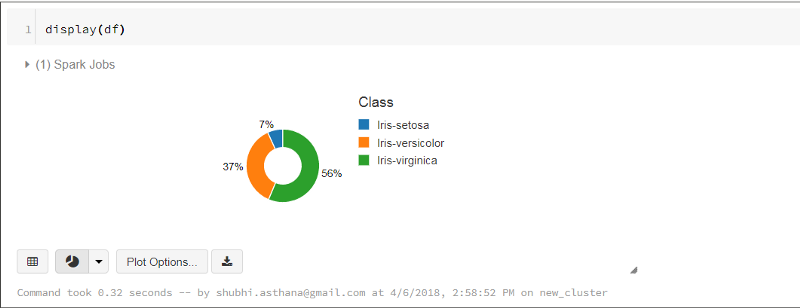
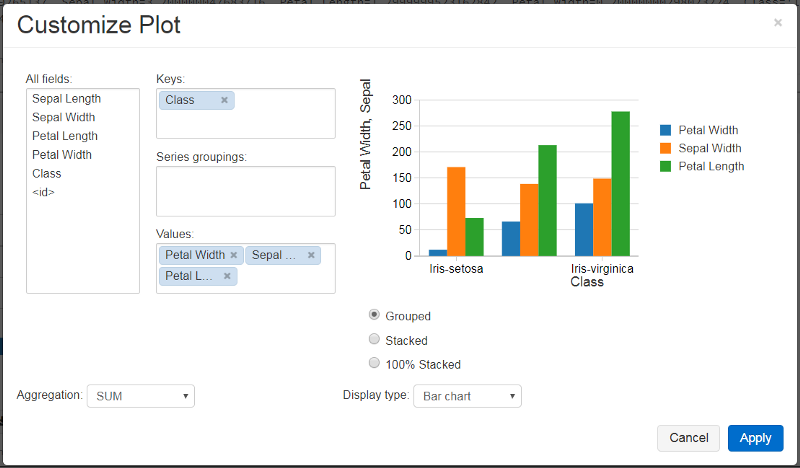
The dropdown button allows you to visualize the data in different charts like bar, pie, scatter, and so on. It also gives you plot options to customize the plot and visualize specific columns only.
You can also display matplotlib and ggplot figures in Databricks. For a demonstration, see Matplotlib and ggplot in Python Notebooks.
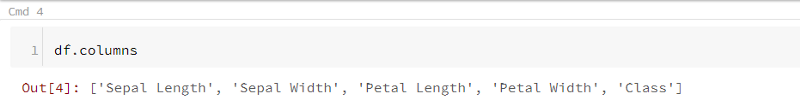
To view all the columns of the data, simply type df.columns
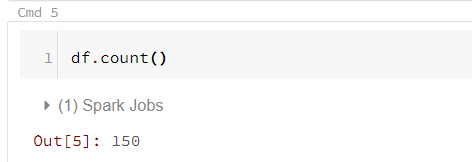
To count how many rows total there are in the Dataframe (and see how long it takes to a full scan from remote disk/S3), run df.count().
6. Converting a Spark dataframe to a Pandas dataframe.
Now if you are comfortable using pandas dataframes, and want to convert your Spark dataframe to pandas, you can do this by putting the command
import pandas as pdpandas_df=df.to_pandas()Now you can use pandas operations on the pandas_df dataframe.

7. Viewing the Spark UI
The Spark UI contains a wealth of information needed for debugging Spark jobs. There are a bunch of great visualizations, so let’s view them in a gist.
To go to Spark UI, you need to go to the top of the page where there are some menu options like “File,” “View,” “Code,” “Permissions,” and others. You will find the name of the cluster at the top next to “Attached” and a dropdown button next to it. Hit the dropdown button and select “View Spark UI.” A new tab will open up with the lots of information on your Notebook.
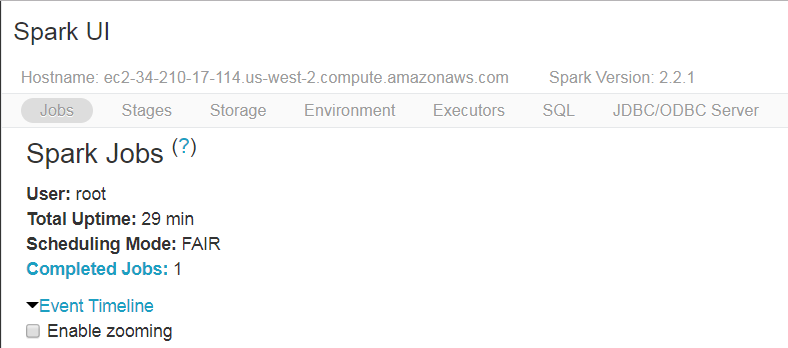
The UI view gives plenty of information on each job executed on the cluster, stages, environment, and SQL queries executed. This UI can be helpful for users to debug their applications. Also, this UI gives a good visualization on Spark streaming statistics. To learn in more detail about each aspect of the Spark UI, refer to this link.
Once you are done with the Notebook, you can go ahead and publish it or export the file in different file formats, such that somebody else can use it using a unique link. I have attached my Notebook in HTML format.
Wrapping up
This is a short overview on how you can get started with Databricks quickly and run your programs. The advantage of using Databricks is that it offers an end-to-end service for building analytics, data warehousing, and machine learning applications. The entire Spark cluster can be managed, monitored, and secured using a self-service model of Databricks.
Here are some interesting links for Data Scientists and for Data Engineers. Also, here is a tutorial which I found very useful and is great for beginners.