
by Alan Wilson
I visualized the data from every single game of Hearthstone I played. All 4,700 of them.
I’ve been playing Hearthstone since the beta. I’m a fairly casual player, but I have aspirations of eventually reaching the prestigious “Legend” ranking.
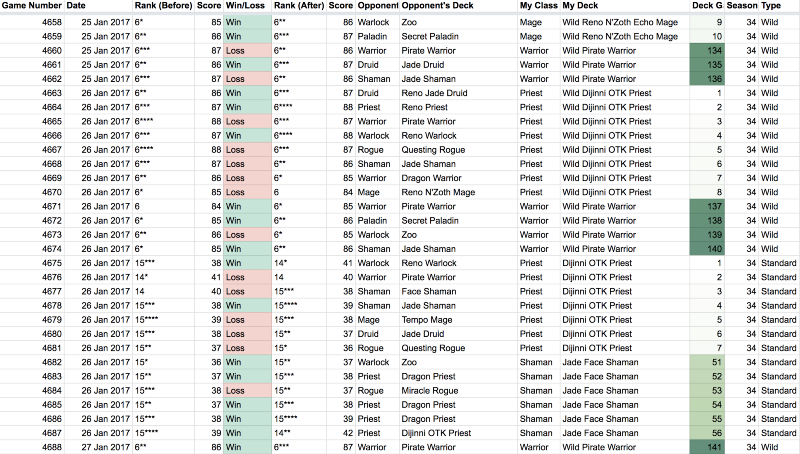
Back in March I started to track my games to see if I had a chance of making it. I play most of my games on an iPad, so this was a manual process in Google Sheets.
Charting Ladder Rank
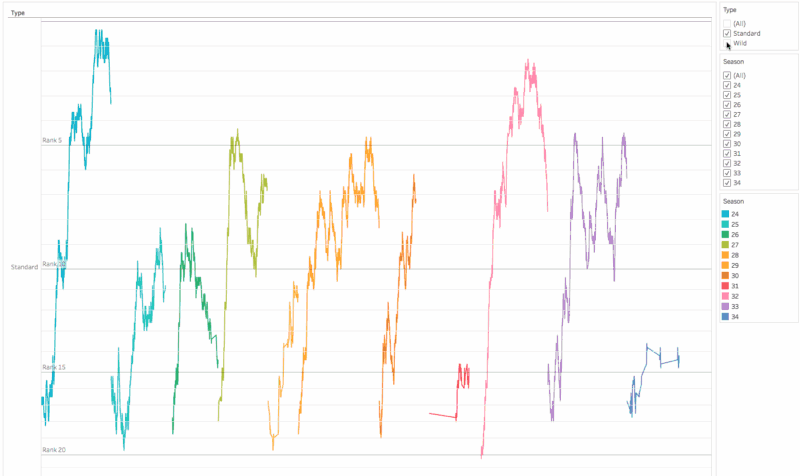
I used some simple conditional formatting to make the table easier to read, but most of my analysis takes place in a free tool called Tableau Public. It starts out very basic—just a line chart of my rank—but even this is useful. Now I can see how well my attempts at Legend are going.
As you can see, my rank was fairly volatile, so I evolved the visualization using moving averages. The raw numbers are still there (in the dots), but the lines now represent a 25-game moving average. This made it easier to see real trends in my rank and reduce tendencies to tilt on losing streaks.
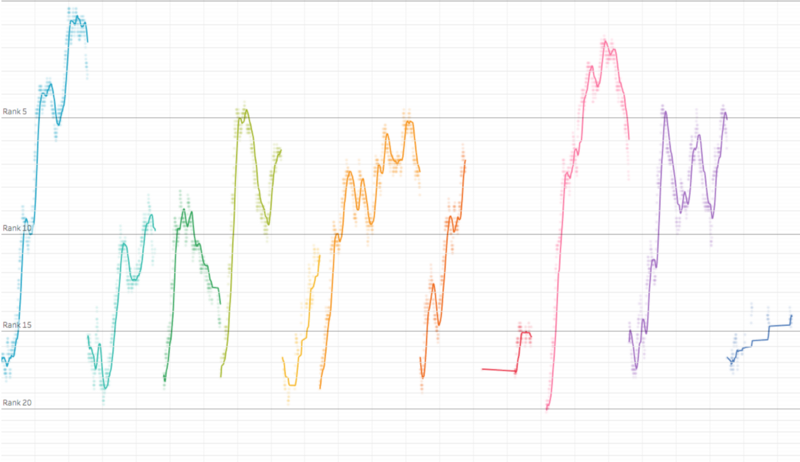
Next I plotted the seasons on top of one another so I could compare them.
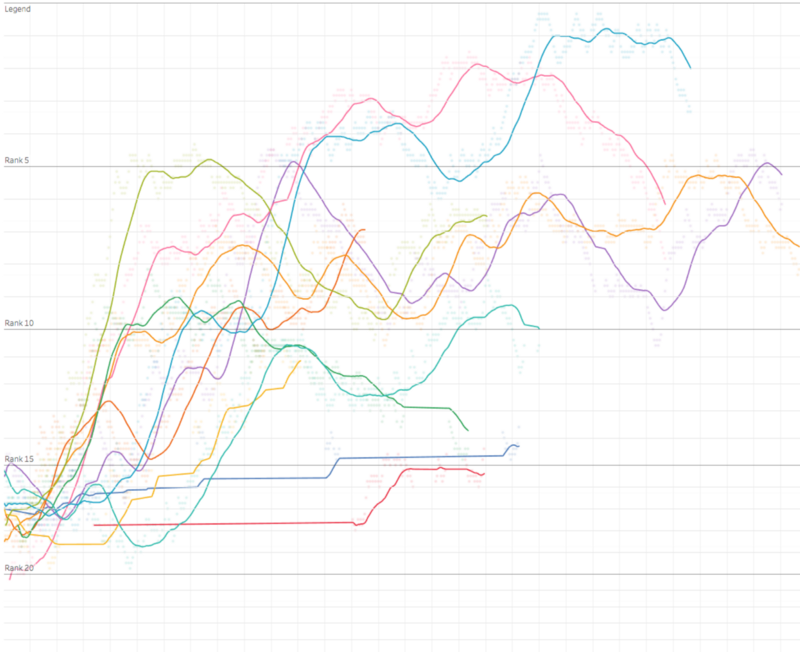
Now I can see how efficient my climb each season is and how it compares to the current season. But I’m still blind to how much time there is left in the season.
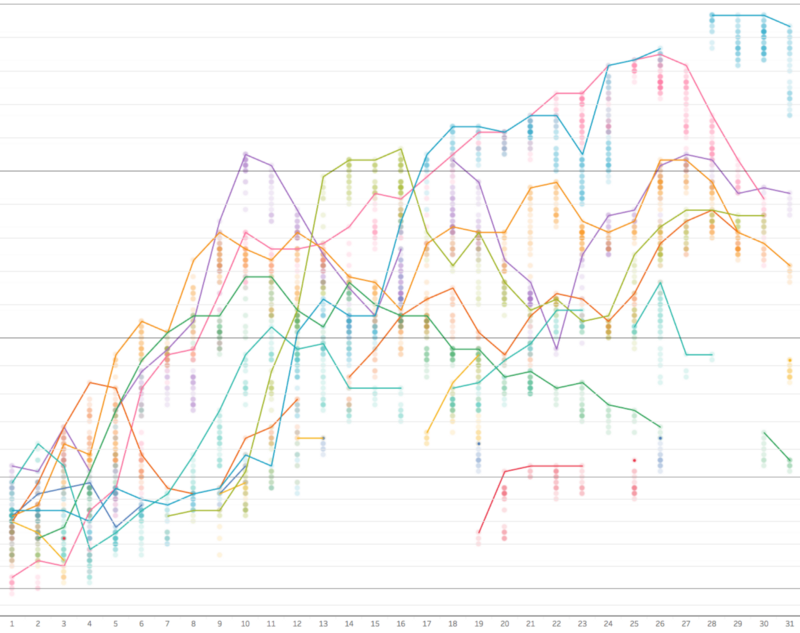
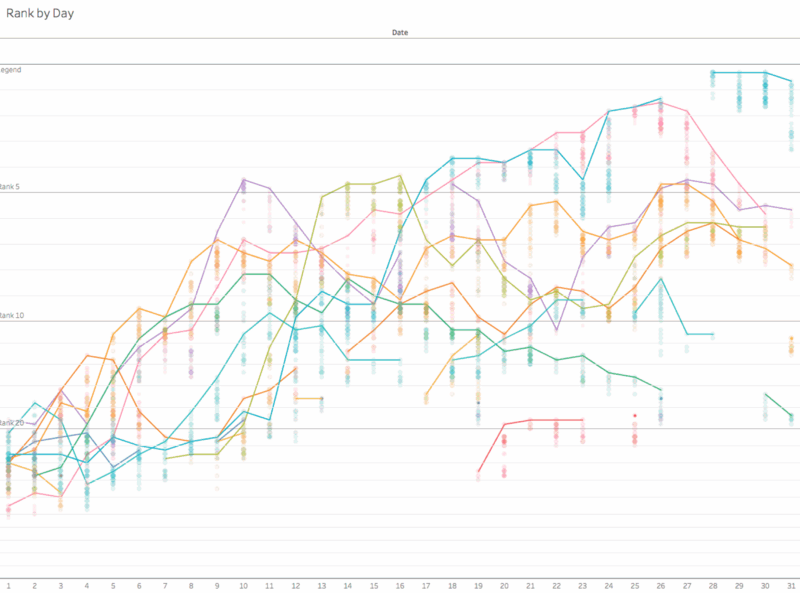
Do I have a day or a week left? Am I ranked higher usual for the 5th day of the season?
To answer these questions I create a chart that tracks progress by day of the season. Here I have strip-plots for each day and a line connecting the maximum rank achieved each day. This is a better way to evaluate my chances of reaching Legend in a given season.
Charting Deck Performance
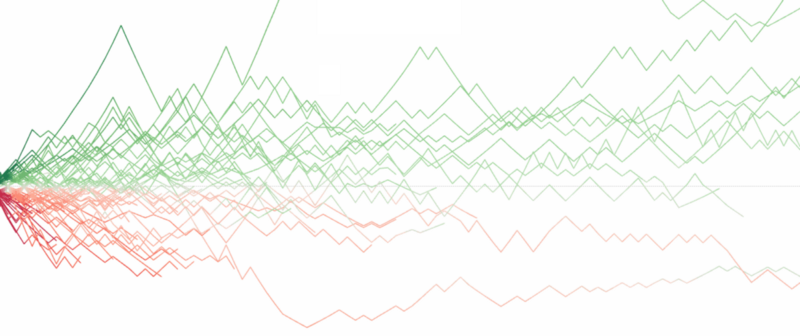
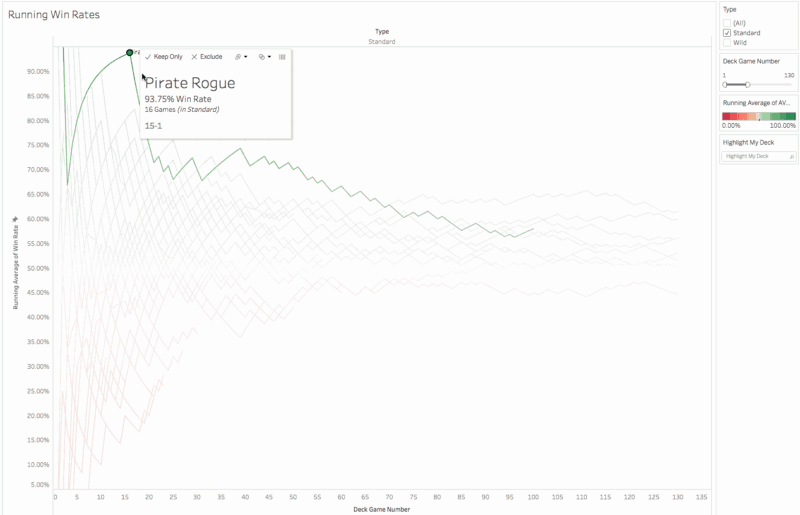
But what about decks? Obviously they play a huge role. When it comes to decks, it’s all about the win-rate, so I visualize each deck as a line. It’s a bit cluttered, but I can see the win-rate, when it stabilizes, and how one deck compares to another. Tableau’s highlight feature is really helpful here.
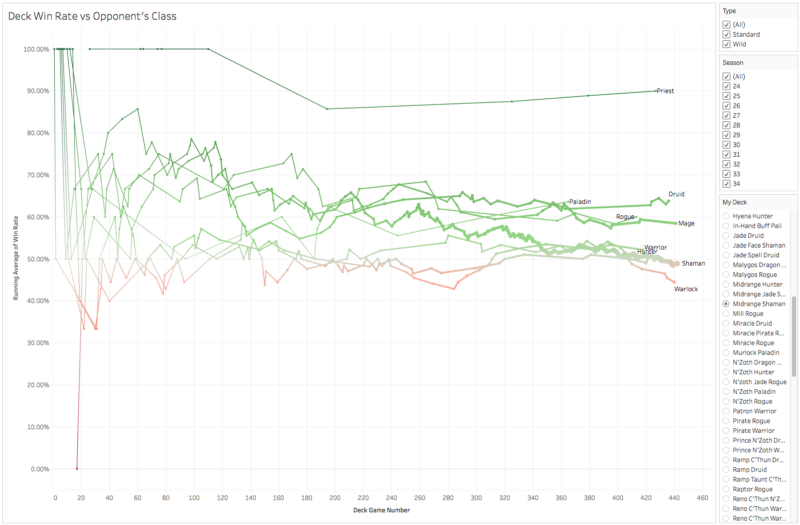
Next I create a deck-specific view of this chart to see how it performs against different classes. I have to play a lot of games before trends emerge, but once they do I get a sense for how common each class is and how I’m performing against it. Depending on the meta, I also get an understanding of deck match-ups.
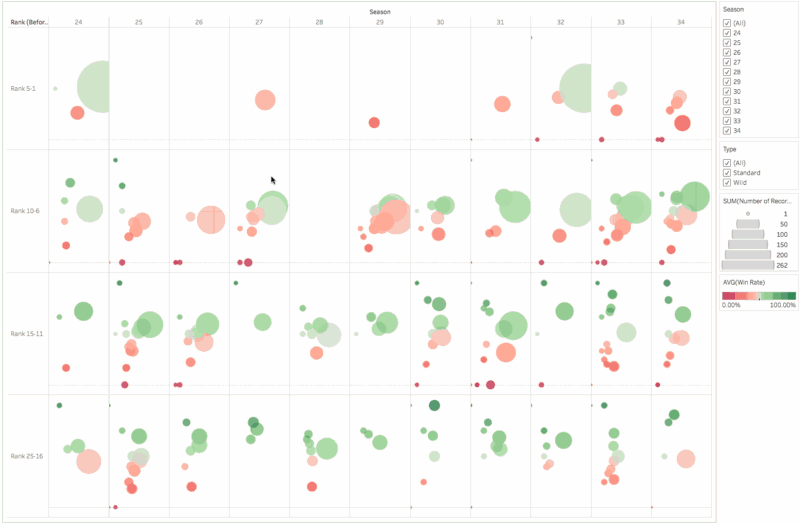
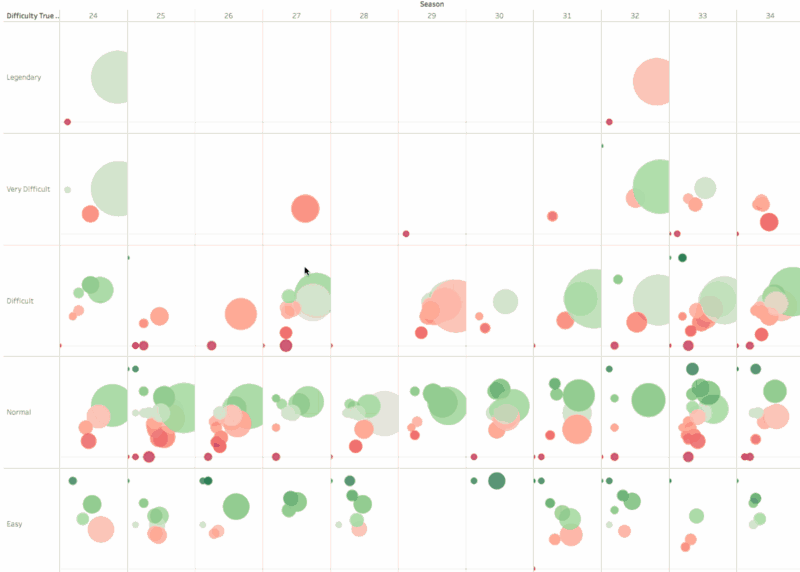
Now, it goes without saying that my win-rate is going to suffer as I get into higher ranks, so I created a bubble chart to help me better understand the performance of my decks at different ranks and seasons.
How Hearthstone’s Ranking System Works
All this got me thinking about difficulty, seasons, and the ranking system (bear with me if you’re well-versed in Hearthstone’s ranking system). First off, the ranking system isn’t linear as one might assume. The ranks (starting at 25 and going up to 1) aren’t spaced evenly because the number of stars in-between each rank changes as you climb up the ladder. All told there are 120 possible placements.
But Blizzard didn’t stop there. They created additional resistance starting at rank 20, and then again at rank 5.
Lastly, Hearthstone has very short seasons—just one month. At the end of every month everyone is sent back down to the bottom of the ladder.
Now, this isn’t news to anyone who plays a lot of ranked games. But it brings me back to my original question: how do I measure the difficulty of a given game?
Modeling Game Difficulty
I began with a few simple assumptions:
- The most difficult game of season is at rank 1 with 5 stars on the first day of the month.
- The least difficult game of the season is at rank 25 with no stars on the last day of the month.
- Any game played later in the month at a given rank is easier than a game played at that same rank earlier in the month.
Using these assumptions as a guide I created a model for difficulty. At first it was very simple (and inaccurate).
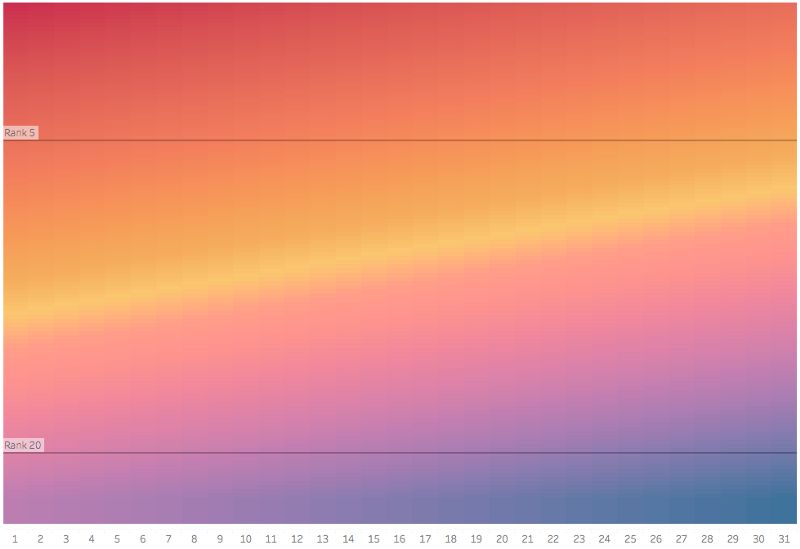
I refined it until it reflected my perception of difficulty. Note that this is not driven by any data and I doubt it’s completely accurate, but it’s better than rank alone at gauging difficulty.
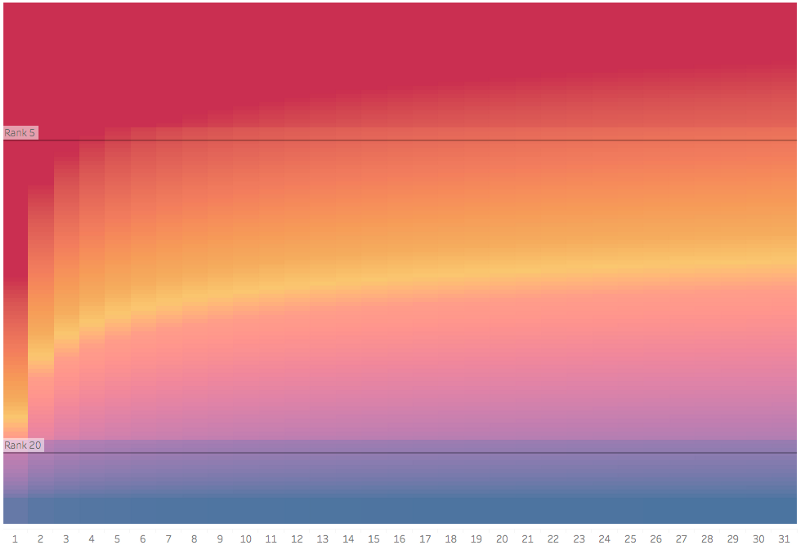
Now let’s revisit some of the earlier charts using this new “difficulty” metric in place of rank. This offers a different perspective — hopefully a more accurate one.
What about that bubble chart? I’ve put difficulty into categories, much like I did with rank and I’m already feeling better about the perspective this provides. It’s equally valuable in the early and late season.
Evaluating Deck Performance
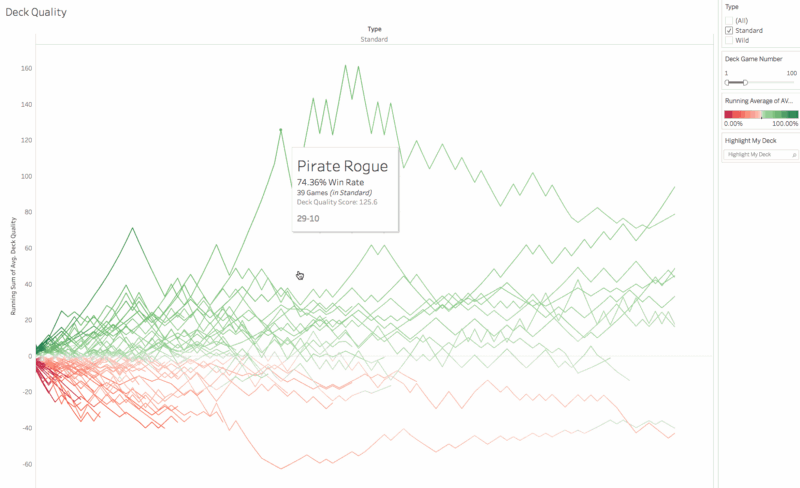
Next I use difficulty to create another metric. This one is pretty straightforward. I call it “quality.” If I win a game I add the difficulty of that game to quality. If I lose a game I subtract the difficulty of that game from quality.
If “win” then + difficulty
Else if “loss” then – difficulty
This allows me to reward winning difficult games more than easy ones and yields some very interesting results. Remember that chart showing win-rates for decks? Well, here it is again but with our new quality metric on the y-axis (color is still win-rate).
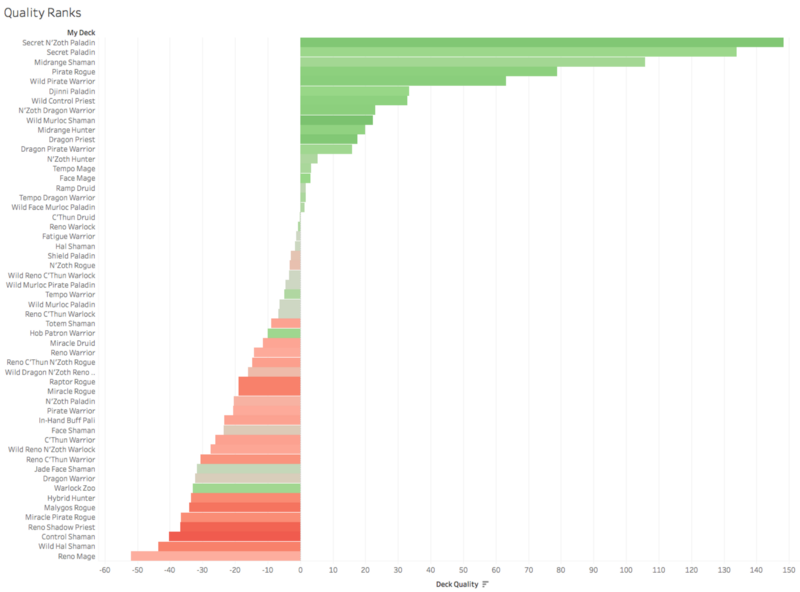
I also summarize this into a simple rank.
What’s Next?
There are still a lot of things I want to explore further with my data-set. It would also be interesting to apply these techniques to pro players and compare them to one another. Are they rank 1 Legend because they win difficult games? Is win-rate alone the best predictor for skill? What role does the volume of games played have on rank advancement?
In case you couldn’t tell from the data I still haven’t made it Legend, but I’m honestly having as much fun analyzing my stats as I am playing the game.