
With a Raspberry Pi, low-cost gas sensors, and a remote-controlled switch, you can control the air quality in your house.
The air we breathe indoors is not always healthier than the air outside.
According to a study of the E.U. Joint Research Centre, you can find a wide range of air pollutants indoors. Some of them are toxic, or can cause genetic mutations or cancer. Factors that influence indoor air quality are:
- ambient air, or the air outdoors
- air tightness and ventilation of the building
- indoor sources like tobacco smoke, heating gases, consumer products, etc.
Do you know how much time you spend indoors? According to the Environmental Protection Agency, Americans spend 87% of their time indoors. In Europe, this average percentage is 90%, according to the JRC. And the more time we spent indoors, the more pollutants we inhale.
So it would be interesting if we track the indoor air quality. In this article, I will explain how I did this with a Raspberry Pi, a GrovePi and some sensors. We will upload the sensor data to a Firebase database and visualize trends with Dash.
When pollutant levels reach an unhealthy level, we can send an alert notification to warn us.
Moreover, it would be great if we could automatically start up the ventilation to purify the air. This can be done with a remote-controlled switch from Energenie.
Raspberry Pi and GrovePi
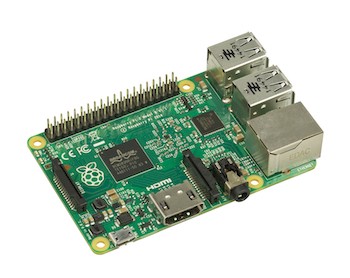
In this project, I will use a Raspberry Pi model 2B. The Raspberry Pi is a low-cost small computer. It enables programmers and makers to build anything they can imagine.
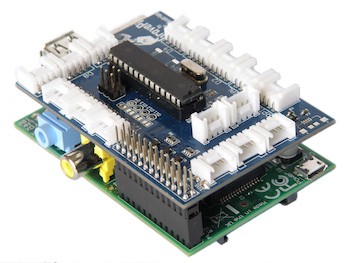
The GrovePi is an electronics board that we attach to the Raspberry Pi. It makes connecting a wide range of sensors easy. As such, you don’t need to bother about a breadboard, resistors, soldering or jumper wires. You can plug in a connector and start working with it.
Data flow
In the illustration below you see how the sensor data will flow from the sensors to the charts on a web page. We’ll be using Python to do all that.
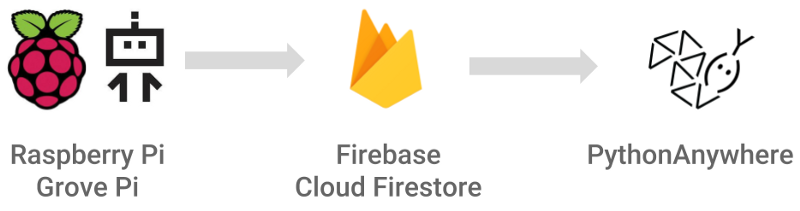
The first step is to pull in the data from the Grove sensors. Then we process the data on the Raspberry Pi and send them to a Firebase database. This data is also used to switch on or off a ventilation unit via a remote controlled switch.
We can get the stored data with a script running on PythonAnywhere.com. With the Dash package, we can build a dashboard to follow up the indoor air quality.
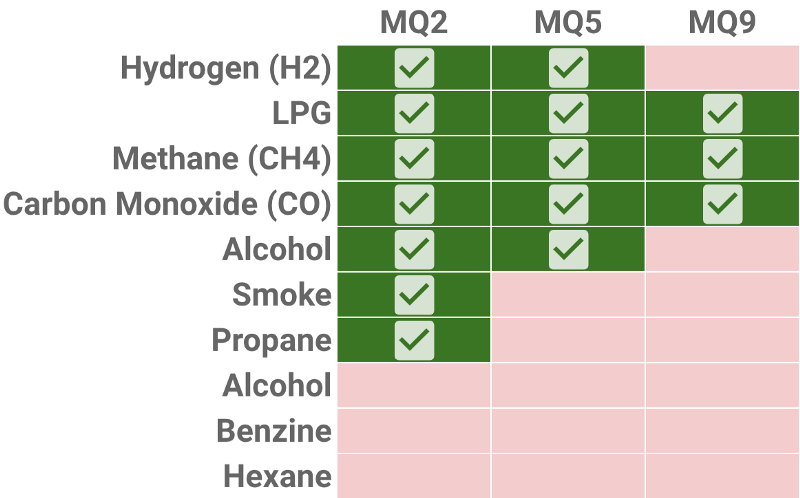
Gas sensors
We will use a set of three different gas sensors for this project. I use Grove gas sensors and connect them to the GrovePi.
It is not necessary to use all three sensors in your own project. Feel free to choose sensors that fit your needs. You can do that in the config.py file by keeping the sensors you need in the Python dictionary MQ_SENSORS.
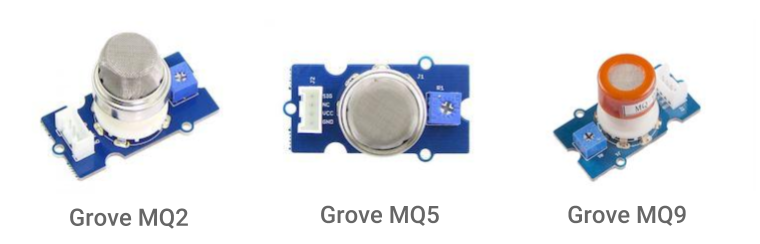
Each sensor detects a specific set of gases. There is quite some overlap between the sensors with regard to the gases they detect. But, the range in which the sensors detect a gas can differ. You can find the ranges on the website of Seeedstudio.
Temperature and Humidity sensor
Temperature and humidity influence the readings from the gas sensors. So, it is interesting to measure temperature and humidity as well. We use the Grove BME680 sensor for that.
Working with sensor data
In short, a gas sensor will output a higher voltage when the concentration of a gas is higher. This is because the built-in resistor varies its resistance (Rs) according to the concentration of the gas.
The sensor value only reflects an approximation of a trend in the gas concentration. This means that you can use it to show whether the gas concentration increases or decreases. It does not give the exact gas concentration. If you want to measure the actual concentration, you would need a more expensive sensor.
For learning purposes, we will use the sensor value to approximate the gas concentration. You should keep that in mind. You should not use these scripts in real-life situations to prevent intoxication by these gases!
On the datasheets listed below, you find a graph with the relation between the gas concentration and sensor resistor values. The gas concentration is expressed in parts per million (ppm). The resistor values as the ratio Rs/R0.
The curves below correspond to the standard conditions of:
- a temperature of 20°C
- a humidity of 65%
- an oxygen concentration of 21%
- a load resistance of 5 kilo-Ohm. The load resistance is the total resistance of an electronic circuit.
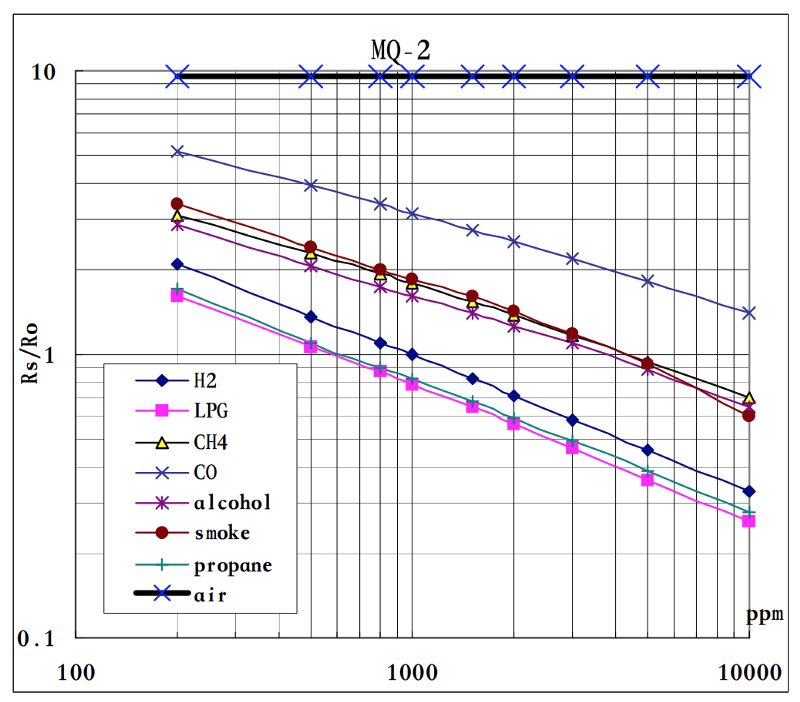
We can assume that the load resistance and oxygen concentration are stable over time. Yet, the temperature and humidity indoors can vary. Both factors have an influence on the sensor readings, as you can see in the graph below.
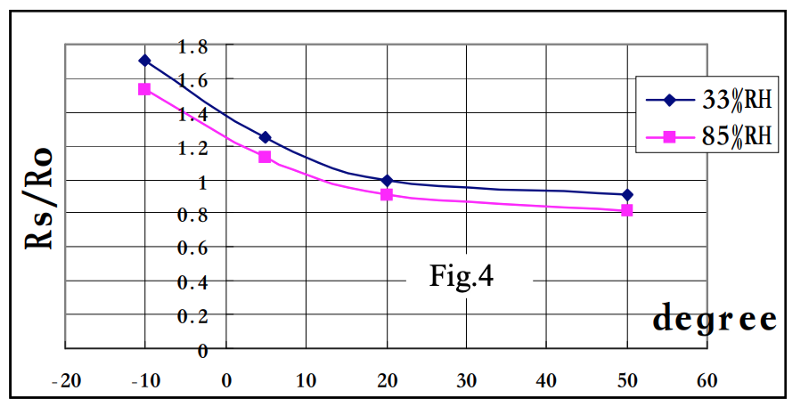
To get accurate readings, you should have a graph or look-up table for various temperature-humidity combinations. Unfortunately, these graphs are not provided by the manufacturer.
Another approach is to correct the sensor readings for the temperature-humidity influence.
We can do this with artificial neural networks, as proposed in the paper by Nenova & Dimchev. That approach requires ground-truth measurements of the gas concentrations. This is out of scope for this article.
Defining the R0 value
First, we need to compute the R0 value. R0 stands for the sensor resistance value of 1.000 ppm of hydrogen (H2)in clean air. The ratio for clean air (black line with blue crosses) is constant. It remains at 9.8 regardless of the concentration of clean air. So, we can compute R0 by reading the sensor value (Rs) in clean air and dividing it by 9.8.
The value we get from the sensor is a value between 0 and 1.023 and has no measurement unit. So, to get the output voltage we divide the sensor value by 1.023. We multiply this value with the circuit voltage, which is usually 5V.
From the sensor voltage, we can derive the sensor resistance by applying Ohm’s law. The sensor resistance is equal to

Let’s see how we do that with Python. The complete code and more documentation can be found on Github in the script get_R0_values.py.
import config as cfg
import grovepi
import time
First, we import some packages. The config package is a Python script I made to store all configuration parameters.
Throughout the code, you’ll notice that I sometimes refer to cfg.PARAMETER_NAME. We set thePARAMETER_NAME value in that config.py file. It also contains some passwords and API tokens.
For security reasons, I will not save that file on Github. Instead, I’ll provide a clean template config_template.py that you can use for your own project.
Next, we import the grovepi package. You can install it from the Github page of Dexter Industries on your Raspberry Pi. It allows us to work with the GrovePi and the connected sensors.
Finally, we use the time package to pause the program during sensor readings.
mq_values = {}

for sensor, data in cfg.MQ_SENSORS.items():
    grovepi.pinMode(data['pin'],"INPUT")
    mq_values[sensor] = 0
We will store the sensor values for the different sensors in the dictionary mq_values. But first, we initialize the values to zero in a loop over the sensors defined in MQ_SENSORS.
With the pinMode method, you can define the pin as INPUT or OUTPUT. In our case, we’ll use it as INPUT.
The pin tells us to which pin on the GrovePi the sensor is connected. We use the analog pins (or ports) which are labeled as A0, A1 and A2 on the GrovePi. Make sure you connect the right sensor to the port described in the config.py file.
for i in range(cfg.NB_R0_READ):
    for sensor, value in mq_values.items():
        mq_values[sensor] += grovepi.analogRead(cfg.MQ_SENSORS[sensor]['pin'])
    time.sleep(cfg.R0_INTERVAL)
We then read the sensor value in a loop for cfg.NB_R0_READ times and sum it up in mq_value[sensor]. We read the sensor value with the analogRead method of the grovepi package.
As described in the documentation, this will return a value between 0 and 1.023. In fact, it converts an analog sensor value to a digital value.
After one reading for all sensors, we pause the program at cfg.R0_INTERVAL seconds. To get the average value, we divide the cumulated value by cfg.NB_RO_READ.
for sensor, value in mq_values.items():
    mq_values[sensor] = mq_values[sensor]/cfg.NB_R0_READ
    mq_values[sensor] = mq_values[sensor]/cfg.AR_MAX * cfg.VC
    mq_values[sensor] = (cfg.VC - mq_values[sensor])/mq_values[sensor]
    mq_values[sensor] = mq_values[sensor]/cfg.MQ_SENSORS[sensor]['r0_rs_air']
We compute the sensor voltage by dividing the averaged sensor value by cfg.AR_MAX. Then we multiply it by the circuit voltage cfg.VC.
From that voltage, we can apply Ohm’s law and compute the sensor resistance value. Dividing that by the ratio for clean air cfg.MQ_SENSORS[sensor]['r0_rs_air'] gives us R0.
It is better to have the sensor working at least for 24 hours before you measure the R0 value. This will give more stable sensor readings.
Linear interpolation of gas concentration
Now that we know the R0 value, we can compute the Rs/R0 ratio with the sensor value. With that ratio, we can derive the gas concentration with linear interpolation.
For that, we assume that we are working in the standard conditions described for the first graph. In that case, the curves are nearly linear.
For linear interpolation, we need two known points of each curve to calculate its slope. Suppose we have two points with the coordinates (x1, y1) and (x2, y2). The y-values stand for the Rs/R0 values and the x-values for the gas concentrations. For a linear curve, the slope is then calculated as:

When we know the slope, we can find the gas concentration(x) for any given Rs/R0 value (y). The formula for this is:

The code snippets below come from the script get_sensor_values.py which you can find on Github.
We put the formula in a function get_ppm. curve['y'] and curve['x'] are the known points on the curve for a gas. curve['slope'] is what we calculated with the previous formula.
You can find these values in the config_template.py file. I derived these values with Webplotdigitizer from the graphs on the data sheets. As a result, these values are not completely accurate. Use them with caution.
Note the use of np.log10 and np.power. This reason for this is that the axes on the graph are in a log-scale.
def get_ppm(Rs_R0_ratio, curve):
    x_val = (np.log10(Rs_R0_ratio) - curve['y'])/curve['slope'] + curve['x']
    ppm_val = np.power(x_val, 10)
    return ppm_val
We calculate the Rs_R0_ratio in the same manner as when calculating the R0 value. So I will not repeat this. To calculate this ratio, we loop over all gases and sensors and store this in ppm_values[mq_sensor][gas].
for gas, curve in cfg.CURVES[mq_sensor].items():
                ppm_values[mq_sensor][gas] = get_ppm(mq_values[mq_sensor], curve)
Temperature, humidity and pressure
Besides the gas sensors, we read the temperature, humidity and pressure with the BME680 sensor. The BME680 sensor is connected to the GrovePi via an I2C port. To use the sensor, we import the package which can be installed from the Pimoroni repo on Github.
import bme680The set_..._oversample methods specify how many samples we take to calculate the average value. We also did that for the gases. With get_sensor_data we read the sensor values.
bme680_sensor = bme680.BME680(bme680.I2C_ADDR_PRIMARY)
bme680_sensor.set_humidity_oversample(bme680.OS_2X)
bme680_sensor.set_pressure_oversample(bme680.OS_4X)
bme680_sensor.set_temperature_oversample(bme680.OS_8X)
bme680_sensor.get_sensor_data()bme680_sensor.get_sensor_data()Storing and retrieving sensor data in Cloud Firestore
Some sensors provide new readings very fast. Other (less expensive) sensors will take more time. For this project, we will read the data every minute. This is set in the config file with FIREBASE_INTERVAL = 60.
In the free Spark plan of Firebase, the Cloud Firestore quota allow for 20K writes per day. With a one-minute interval, we will be well below that quota. The limit for reading documents in the Firestore is 50K per day.
You’ll need to create a Firebase project and create a Cloud Firestore. After that, make sure to generate the credentials to authenticate your application. Save the credentials file in a secure location.
To work with Firebase via Python, we need to import the firebase_admin package. This package needs to be installed on your Raspberry Pi first, if needed.
import firebase_admin
from firebase_admin import credentials
from firebase_admin import firestore
After that, we can initialize the Firebase app with credentials. I store the location to the credentials file in cfg.FIREBASE_CREDS_JSON. When the app is initialized, we create a Firestore object db.
firebase_path = Path.cwd() / cfg.FIREBASE_CREDS_JSON
cred = credentials.Certificate(str(firebase_path))
firebase_admin.initialize_app(cred)
After processing the gas values, it is time to store them in the Cloud Firestore. We will create a dictionary firebase_values to gather all the data. With a dict comprehension, we add the values for all gases for all MQ sensors. The BME680 values and timestamp are also added.
With the add method of the Firestore object db, it is easy to store the data in the Firestore.
The name of the collection in the Firestore is cfg.FIREBASE_DB_NAME. Learn more about the data model of Firestore on the Firebase website.
firebase_values = {mq_sensor + '_' + gas + '_ppm': ppm
                            for mq_sensor, gases in ppm_values.items()
                            for gas, ppm in gases.items()
                          }
firebase_values['temperature'] = bme680_sensor.data.temperature
firebase_values['pressure'] = bme680_sensor.data.pressure
firebase_values['humidity'] = bme680_sensor.data.humidity
firebase_values['date'] = datetime.now()
db.collection(cfg.FIREBASE_DB_NAME).add(firebase_values)
After storing the data, we wait a minute to start over with the following line of code.
time.sleep(cfg.FIREBASE_INTERVAL)Improving the air quality
If the air quality indoors is not good we should take measures to improve it. Before we can do that, we need to be notified about critical gas concentrations.
One possibility is to send an alert notification by email, which we’ll discuss below.
Sometimes the source of indoor air pollution comes from outdoor air. For example, when your neighbors have wood-burning stoves or when you live near a factory.
In that case, you could install your measurement station outside and turn off the ventilation unit in your house if outdoor air quality is bad. With a remote-controlled switch, this can be done easily.
All code for this section is in improve_air_quality.py on Github.
Sending notifications when air quality reaches a critical level
We do not want to send an email each time the sensor outputs critical values (here, each minute).
Let’s say we want to check each hour whether there were critical values in the last hour. For that, we need to keep track of a reference_time. We initialize this when the program for readings sensor values starts. The interval at which we check again for critical gas concentrations is defined in cfg.ALERT_INTERVAL.
reference_time = datetime.now()When an hour has passed since reference_time, we can start to check if there were critical air pollutant values. We update reference_time with the current time.
With the pytz package, we can take into account our timezone. In my case, that is Europe/Brussels. We compute one_hour_ago by subtracting 60 minutes from the current time.
if datetime.now() > reference_time + timedelta(minutes=cfg.ALERT_INTERVAL):
    reference_time = datetime.now()
    brussels_tz = pytz.timezone('Europe/Brussels')
    prev_check_time = brussels_tz.localize(datetime.now()) - timedelta(minutes=cfg.ALERT_INTERVAL)
With prev_check_time we extract the sensor readings from Firebase of the last hour. We do that by applying a where clause to the data that we get from the Cloud Firestore.
In this script, we will only use one gas sensor and a limited set of gases. The sensor is selected in cfg.ALERT_SENSOR. The gases are selected in cfg.ALERT_GASES. The data per gas is appended to ppm_vals as well as the timestamps.
timestamps = []
ppm_vals = {}
for gas in cfg.ALERT_GASES:
    ppm_vals[gas] = []

docs = db.collection(cfg.FIREBASE_DB_NAME).order_by(u'date').where(u'date', '>=', one_hour_ago).get()

for doc in docs:
    data = doc.to_dict()
    for gas in cfg.ALERT_GASES:
        ppm_vals[gas].append(data[cfg.ALERT_SENSOR + gas + '_ppm'])

    timestamps.append(data['date'].strftime('%H:%M:%S'))
We look for critical values with the function find_crit_val. We will only check if the value surpassed an upper bound ubound. These upper bounds need to be specified in the config file.
The data are in ascending chronological order. Thus, we can use the next method to find the first timestamp for which v > ubound. We return a tuple containing the timestamp of the critical value and the critical value itself.
If there is no critical value, we return the tuple (None, None).
def find_crit_val(timestamps, val_list, ubound):
    try:
        (crit_time, crit_value) = next(((i,v) for i, v in zip(timestamps, val_list) if v > ubound))
    except:
        (crit_time, crit_value) = (None,None)
    return (crit_time, crit_value)
The critical tuples are stored in a dictionary crit_dict. As the key, we use the gas name. We then check for gas-sensor combinations with a critical timestamp and critical value. In that case, we add an alert message to critical_msg.
crit_dict = {}
for gas in cfg.ALERT_GASES:
    (crit_time, crit_value) = find_crit_val(timestamps, ppm_vals[gas], cfg.UPPERBOUNDS[gas])
    crit_dict[gas] = (crit_time, crit_value)
critical_msg = ''
    for k, v in crit_dict.items():
        if v[0] is not None and v[1] is not None:
            critical_msg += '\nCritical value for ' + k + ' of ' + str(v[1]) + cfg.UNITS[k] + ' at ' + str(v[0])
If critical_msg is not empty, we send an email. Sending an email is done with the smtplib package. How to send an email with Python is explained on AutomateThe BoringStuff.com.
You need to generate an application-specific password for your email if you are using Google’s two-factor authentication.
if critical_msg != '':
    try:
        msg = MIMEText(critical_msg, _charset='utf-8')
        msg['Subject'] = Header('Air Quality Alert', 'utf-8')
        smtpObj = smtplib.SMTP('smtp.gmail.com', 587)
        smtpObj.ehlo()
        smtpObj.starttls()
        smtpObj.login(cfg.EMAIL, cfg.EMAIL_PW)
        smtpObj.sendmail(cfg.EMAIL, cfg.EMAIL, msg.as_string())
        smtpObj.quit()
    except smtplib.SMTPException:
        print('Something went wrong while sending the email')
Automatically control your ventilation unit
With a remote-controlled switch, we can turn on or off any device that is connected to it. Thus, also a ventilation unit. Energenie creates the PiMote add-on specifically for the Raspberry Pi. To control the Energenie switch, you need to install the energenie package and import it.
Note that you can not attach the PiMote on top of the GrovePi. So you’ll need a second Raspberry Pi.
When starting the script, the first thing we do is define a boolean variable ventilation_on. We set it to False because this is the first time we run the script.
import energenie
ventilation_on = False
If critical_msg is not empty, there was a critical gas concentration in the last alert interval. In that case, we turn on the ventilation with the switch_on method of the energenie package.
If there was no critical gas concentration and the ventilation was switched on in the last alert interval, we can switch it off.
You might need to set another interval before switching your ventilation off. That depends on the flow rate of your ventilation unit, the gases measured and whether the pollution source has been disabled.
if critical_msg != '':
    if not ventilation_on:
        energenie.switch_on(1)
        ventilation_on = True
else:
    if ventilation_on:
        energenie.switch_off(1)
        ventilation_on = False
Visualization of air quality with Dash
A notification with critical gas concentrations can help to take immediate action. But it is also interesting to track the gas concentrations over time. By visualizing the sensor values in a dashboard, we can look at the trend of the gas concentrations. This can be done with Dash. On the website of Dash, you can find a great tutorial on how to get started.
In this project, we will build a dashboard and host it on PythonAnyWhere.com. To use Dash on PythonAnywhere, you need to create a virtual environment. You can follow the steps of this demo on how to set-up a Dash app on PythonAnyWhere.
Below I will show how I built the dashboard for our air quality station. The full script can be found in plot_sensor_values.py on Github.
First of all, you need to import the dash package.
import dash
import dash_core_components as dcc
import dash_html_components as html
In the demo on the Dash website, they use a link to a Cascading Style Sheet (CSS) to provide a nice page design. If you want to use a local CSS on your laptop or web server, you can add an assets folder. In that folder you can add your CSS and Dash will pick it up from there.
Then you’ll need to get the data from Firebase. This can be done similarly as we did for sending the alert notifications. So we will not go over that again.
With the data collected from Firebase, we can fill the graphs in our dashboard. We first create a Dash object app and give it a title.
app = dash.Dash(__name__)
app.title = 'Indoor Air Quality Dashboard'
Then we create the layout of the dashboard. A H1 heading component, a container div and a div containing the graphs.
app.layout = html.Div([
    html.H1(style={'textAlign':'center'}, children='Indoor Air Quality Dashboard'),
    html.Div(id='container'),
    html.Div(graphs)
])
graphs is a list that contains the info per graph. Below you can see how the graph for temperature is set up. You can add the dcc.Graph for humidity and pressure as well by appending them to graphs.
graphs = [
    dcc.Graph(
        id='temperature',
        figure={
            'data':[{
                'x':timestamps,
                'y':temperatures,
                'type':'line',
                'name': 'Temperature',
                'line': {'width':2, 'color': '#542788'}
                }],
            'layout':{
                'title': 'Temperature',
                'yaxis': {'title': 'Celsius'},
                'xaxis': {'title': 'Timestamp', 'tickvals':timestamps}
            }
        }
    )
]
The graphs for the MQ sensors can be appended in a for loop.
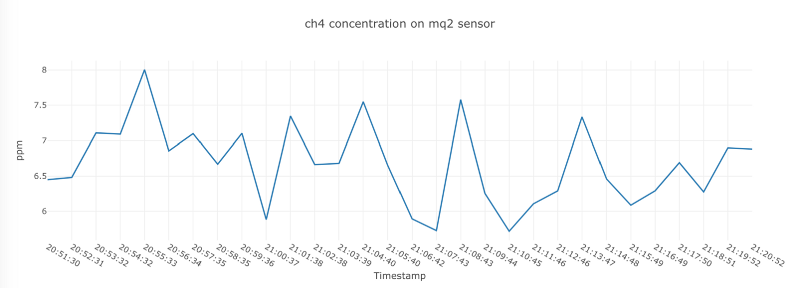
for mq_sensor in cfg.MQ_SENSORS.keys():
    for gas in cfg.CURVES[mq_sensor].keys():
        sensor_gas_key = mq_sensor + '_' + gas + '_ppm'
        title = gas + ' concentration on '+ mq_sensor + ' sensor'
        data = ppm_values[mq_sensor][gas]
        data.reverse()

        graphs.append(dcc.Graph(
            id=sensor_gas_key,
            figure={
                'data': [{
                    'x': timestamps,
                    'y': data,
                    'type':'line',
                    'name': title,
                    'line': {'width':2}
                }],
                'layout': {
                    'title': title,
                    'yaxis': {'title': 'ppm'},
                    'xaxis': {'title': 'Timestamp', 'tickvals':timestamps}
                }
            }
        ))
As a result, you will have a dashboard with graphs like the one below.
Conclusion
With a few low-cost gas sensors and a Raspberry Pi (and GrovePi) it is easy to build an air quality measurement station. You can then act on the data by sending alert notifications when air quality is bad or switch on the ventilation. With Dash you can build beautiful visualizations to monitor the air quality over time.
Below I noted some ideas to take this project further.
- make a mobile app for the visualizations and receiving notifications
- add LEDs, a buzzer and an OLED display to the Raspberry Pi to get instant feedback on air quality
- install measurement stations at your family and friends' place and visualize it on an interactive map.
- once you have enough data, build a time-series model to predict the indoor air quality
Hopefully, this story motivates you to start building your own measurement station. If you have questions or suggestions let me know.