

In 2008, the Center for Urban Economic Development surveyed 4,387 low-wage workers in Chicago, Los Angeles, and New York City. They wanted to determine the extent of violations of employment laws in core sectors of the US economy.
They discovered that:
- 76% of those who worked more than 40 hours were not paid the legally required overtime rate.
- 68% of the sample experienced at least one pay-related violation in the previous work week.
- The average worker lost $51 of his or her weekly earnings of $339 due to wage theft. This loss translates to over $2,652 in losses over one year (out of a total average salary of $17,616).
Furthermore, this study estimates that workers across the country lose a collective of $50 billion per year due to wage theft.
Even though this study was conducted eight years ago, the findings are still relevant: the majority of low-wage workers are the victims of wage theft. If they want to recover their lost wages, they must turn to the courts. Because so many low-wage workers work in exploitative situations, their employers fail to keep the required records that would show the number of hours that a worker may have worked or the pay that the worker received each week. Without these records, workers must rely on their evidence as to their work hours and pay.
Frequently, lawyers must rely on the clients to remember and then construct a schedule of their whereabouts for several months, which makes for a weaker case. That is where this story begins.
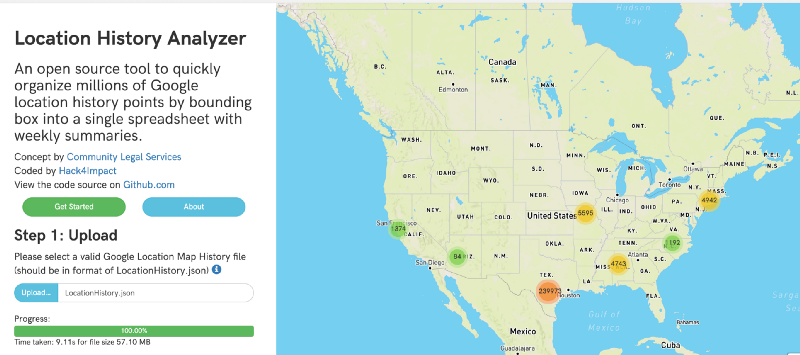
Over the past semester, my team and I at Hack4Impact had the opportunity to work with Community Legal Services of Philadelphia (CLS), a pro-bono legal clinic which has served over one million low-income Philadelphians since its founding in 1966.
We were tasked with creating a website to analyze a client’s Google Location History and create a timesheet for all the times a client entered and exited a user-inputted workplace. The intention was to use the worker’s google location history to supplement their own testimony to provide a more solid case as to how much the client is owed. Since most potential clients carry low-cost phones (typically Android) and do not location history tracking, this solution would prove to be incredibly helpful as a starting point for reconstructing a client’s court-admissible time sheet for their case, giving CLS lawyers + paralegals a completely new source of evidence from a reliable source.

Project User flow:
Our optimal user flow worked out to the following (note, I am putting pictures of this from our live product for you to better visualize these requirements):
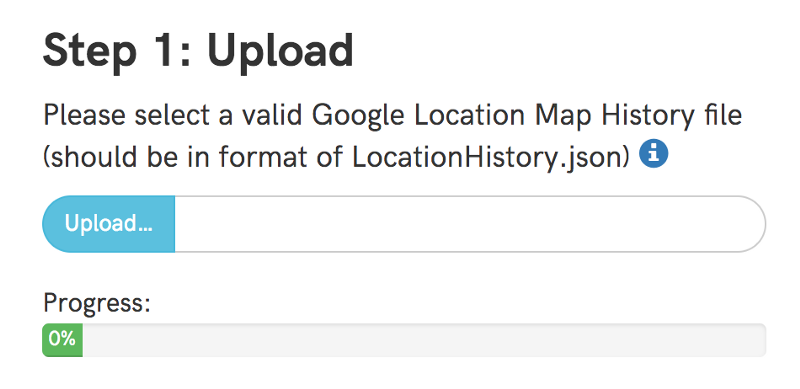
- A user should be able to add their LocationHistory.json file (downloaded from Google Takeout).
- A user should then be able to have their location data processed and displayed on a map
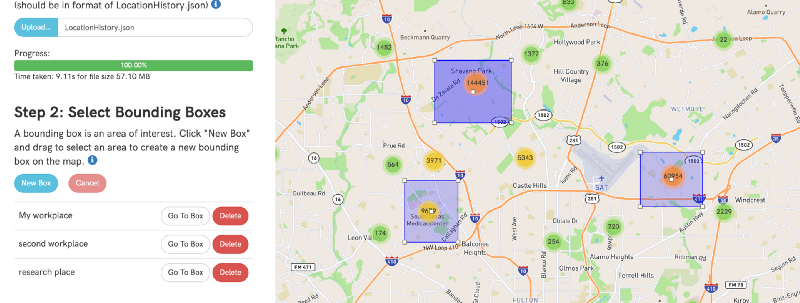
- A user should then be able to select a bounding box area containing the rough area of their work place.
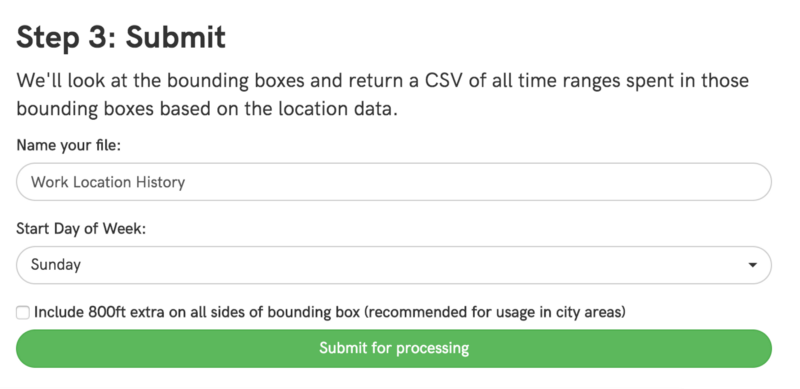
- A user should then be able to select a start day for the week and submit the file for processing.
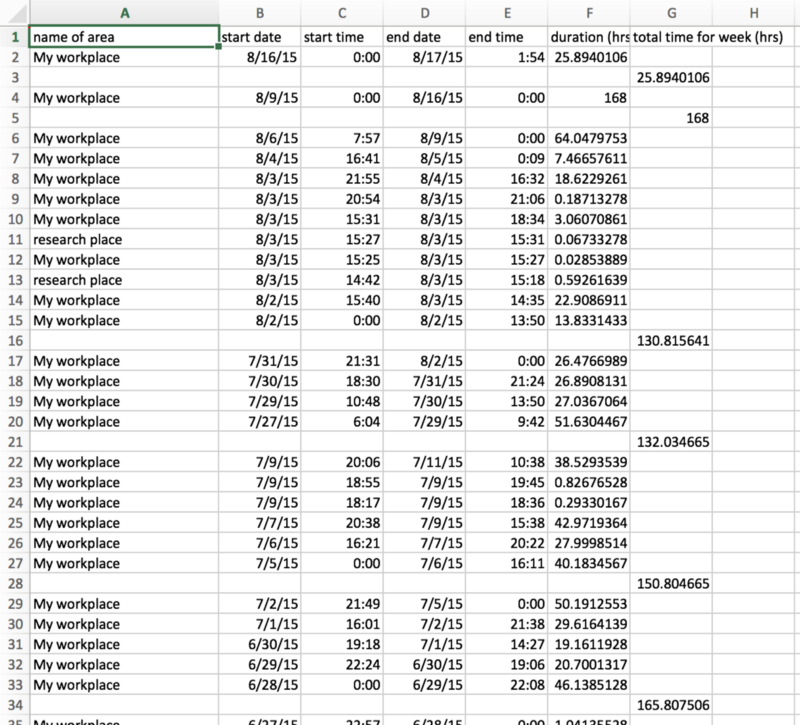
- The location history should then be processed into a .csv file. This file should have rows containing the amount of time a user spent within a bounding box for a workplace (along with start and end times).
- If a user leaves and then enters a workplace, these should appear as separate rows. At the end of a week, the total amount of hours should be tabulated and displayed in a separate column.
On top of everything, all of this had to be done on the front end to avoid privacy issues with storing location data on our servers. These requirements alone seemed to be relatively easy to do. Little did I realize that parsing and displaying a LocationHistory.json file would probably be the most challenging task.
Google LocationHistory.json Structure & First Attempt At Loading:
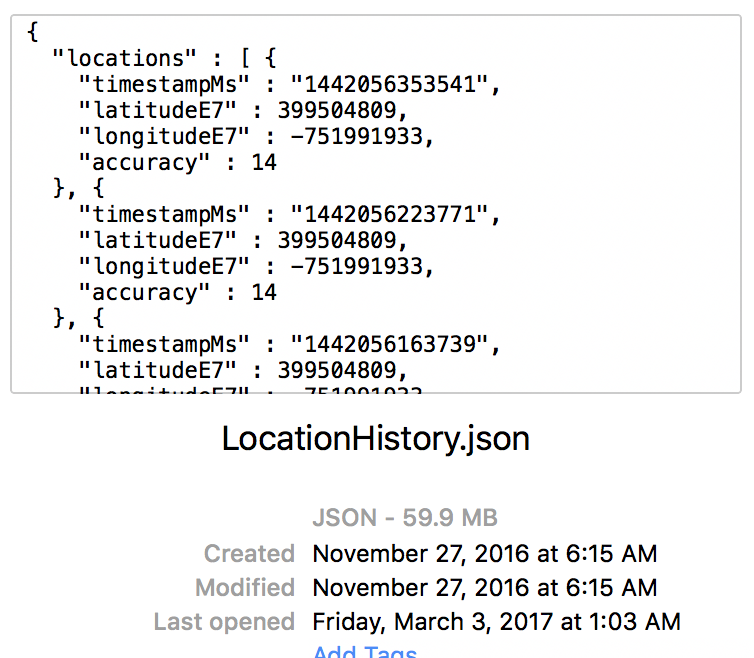
In case you did not know, Google keeps an eye on almost everything you do. More specifically, they do keep track of your Location History if you have an android phone and have not turned it off by now. If you want, you can download your history to date by going to takeout.google.com/settings/takeout and downloading your file in JSON format (be warned…it can be enormous).
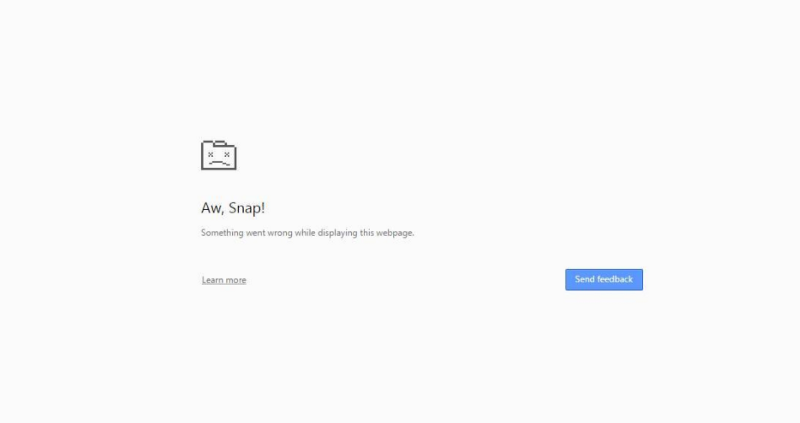
My LocationHistory.json alone was about 59.9 MB in size (I had an Android phone for about two years), but some of the clients who would be using our system could have location histories a few hundred megabytes in size. Trying to just load the whole JSON file into memory causes the browser to hang for approximately 30 seconds before triggering the classic “Aw Snap” error on chrome (usually indicating an out of memory error).
In fact, when running this on a more powerful machine, we can take a memory snapshot and try and see what is going on. For reference, I used a 59.9 MB file that I loaded into memory.
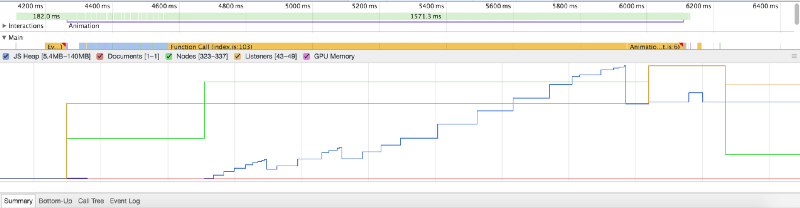
Here, we see that the resulting JS Heap size is nearly triple the actual file size. But in reality, we don’t need to store the whole array in memory, parse it for location data points, and then feed those points into a function that displays them on a map. We could just do this all on the fly…however, that is easier said than done.
Chunking & Oboe:
The first solution I thought of was to try and split the file into more manageable chunks of 512 kilobytes at a time. However, this has some inherent flaws with it, mainly that the file that I am trying to load in contains a large “string” that has the format of a JSON object (but isn’t an object yet). Thus when I decide to split and process the file in sequential pieces that are 512 KB long, I can easily run into a situation where I cut an “object” in half.
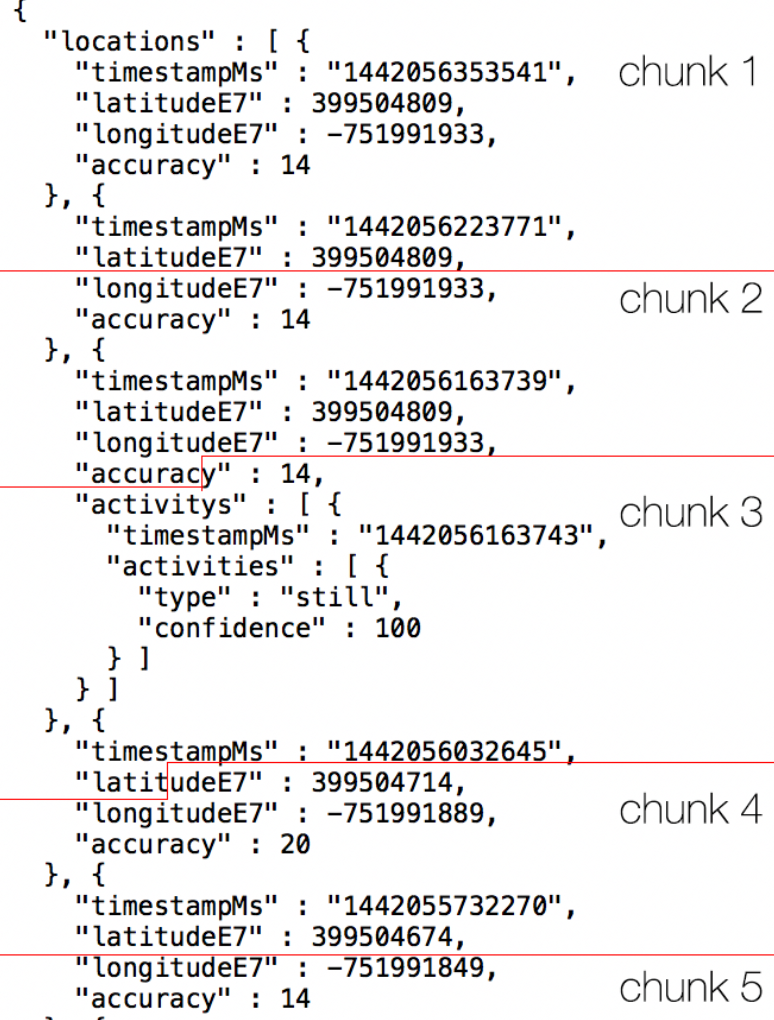
So now I needed a way to keep track of half completed objects/objects that were cut off and prepend/append them to the following chunks accordingly to make sure that everything would parse correctly. Though the Google LocationHistory.json file is relatively uniform, the way that chunks can be split is not. Luckily there is an existing library to help take care of all the edge cases that can arise. Enter Oboe.js.
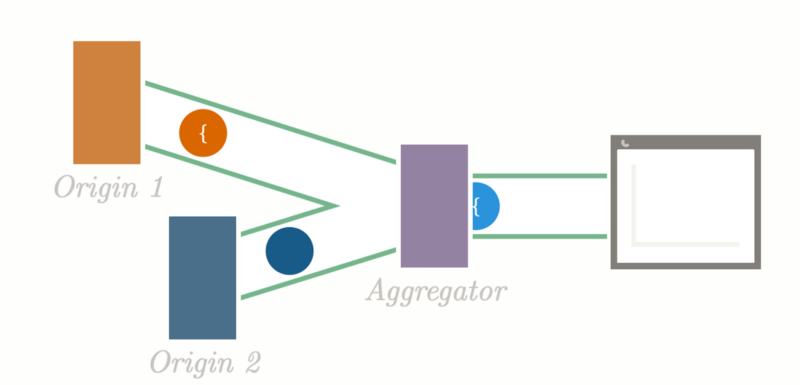
Oboe.js is built for dealing with JSON coming from a streaming source. Additionally, it can load JSON trees larger than the available memory on the client as it only processes one JSON node at a time and then drops the node from the memory tree. However, I do not have a streaming source of data. Luckily, after looking around the Oboe codebase for a bit, I found that oboe can be instantiated and passed data through an emit event.
The oboe code itself is relatively easy to set up. The JSON file we are looking at has the general form of the following.
{ "locations": [ { "timeStampMs": ..., "latitudeE7": ..., "longitudeE7": ..., "accuracy": ... }, { "timeStampMs": ..., "latitudeE7": ..., "longitudeE7": ..., "accuracy": ... }, ... ]}Per Oboe documentation, the locations node should be targeted and any sub object of that will be passed into the callback function as shown in the code sample below.
Next, we need to figure out a way to pass in chunks to this function. The chunking function itself is a little bit more complicated, but the main functionality is to process the file in 512 KB portions at a time. The function takes in the file itself (from an input) and the instance of oboe.js (in our case the os variable).
Note on line 11 the following:
oboeInstance.emit('data', chunk);That line contains the crux of the processing by oboe. The chunk will be sent to our oboe instance in the os variable as a quasi-stream of data.
Displaying the Points:
The last thing to take care of is displaying the data. We chose to use leaflet.js because it was fairly simple to set up and it has a much more diverse 3rd party library ecosystem than Google maps (or any other map library out there that I know of).
Initializing the map on a div with id='mapid' is fairly straightforward:
However, displaying over 1 million location data points requires much more than what the base leaflet.js library can handle. Fortunately, many open source solutions utilize Hierarchical greedy clustering to cluster points at low zoom levels and de-cluster them as the zoom level increases. Vladimir Agafonkin from Mapbox wrote an excellent blog on the algorithmic side of how this process works, and I would highly encourage you to check it out.
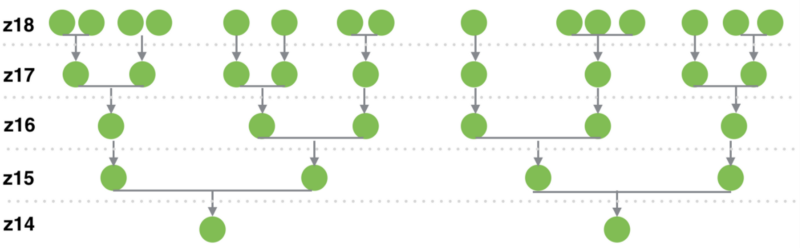
An existing implementation of marker clustering for leaflet exists already with the PruneCluster library. This library sets itself apart from the others because it has no real upper limit to how many points it can process (it is only constrained by the computing power of the client). The resulting render and update times are amazing.
Going back to our oboe.js instance code, we can edit it slightly to account for the PruneCluster library addition:
Results:
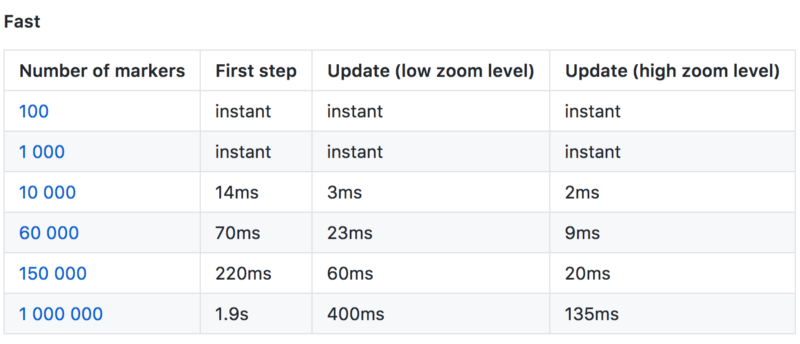
After making all the changes above, I was finally able to do some basic tests to see if whether all these optimizations would be worth it. Below are the results (at each file size five trials were done and the time is the average).
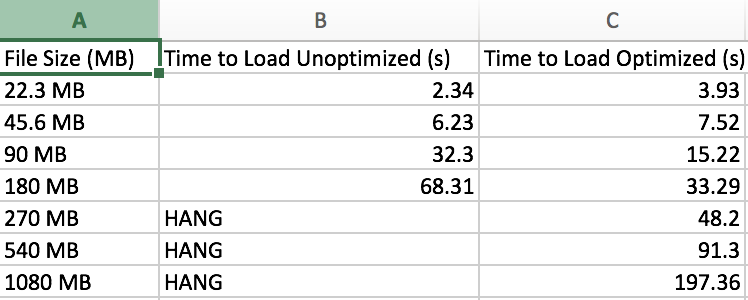
The results were stunning. Although loading the file straight into memory was faster for smaller files, the chunking with oboe stream paid off in the end and gave a nearly linear correlation between load time and file size! In the end, we attached a loading bar to the analyzer to give the user a sense of progress and attached some load time statistics to it.
And there you have it. Parsing of Google Location History on the frontend. No server needed. In fact, I am hosting the website on github page right now at hack4impact.github.io/cls.
Overall, this project was a huge success. During the semester, I interacted with some of the incredible people at Community Legal Services to create this product which will aid many legal workers for years to come. I would highly encourage those who know how to program to volunteer their skills to assist community organizations better achieve their mission. It is an incredibly rewarding experience for both parties and will challenge you to apply your skills towards creating sustainable and functional products.
You can find the source code for the project at our repository.
My full team is: Product Manager: Krishna Bharathala, Team Members: Katie Jiang, Daniel Zhang, Santi Buenahora, and Rachel H.