D3.js is a JavaScript library which allows you to bring data to life using HTML, SVG, and CSS. Learning it will give you superpowers when it comes to extracting value from data, as you’ll basically be able to create any visualization you can think of.
However, it’s not the easiest library to learn, so getting started can be a bit tricky. That’s why we’ve teamed up with web developer and instructor Sohaib Nehal and created a free full-length course on it. Throughout the course, Sohaib will give you a soft introduction to the powerful library.
Let’s have a look at how it’s laid out!
The content
The course consists of 10 screencasts which in total last less than an hour. It starts off with the most basic concepts, like selection, manipulation, data loading, and more. This lays the groundwork for the various visualizations you’ll learn to create throughout the rest of the course.
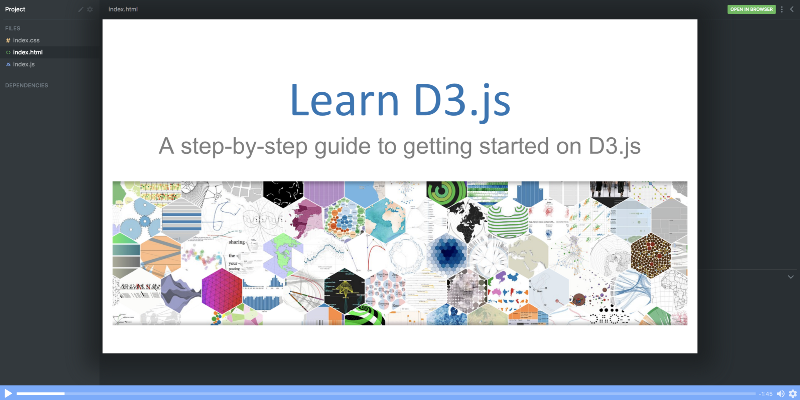
#1: Course introduction
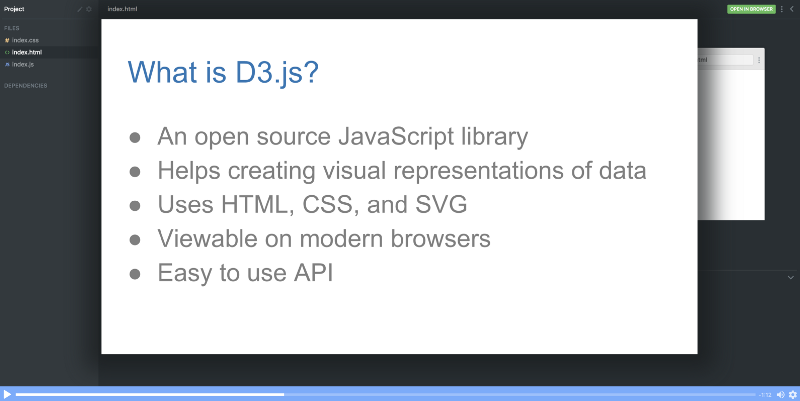
As usual with Scrimba courses, it begins with a quick walk-through of the course content, along with an intro to D3.js and the instructor.
#2: Selection and Manipulation
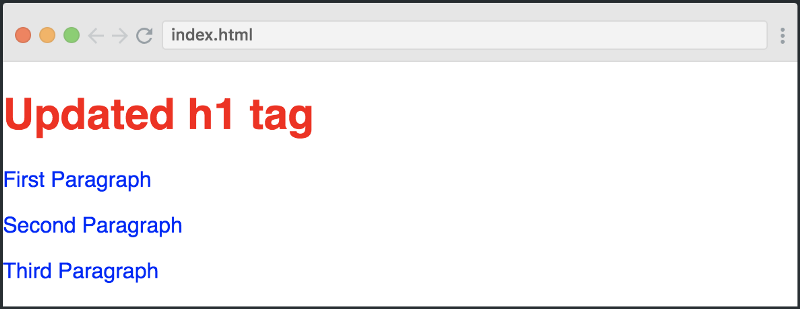
The first thing you need to learn is how to select and manipulate DOM elements with D3.js. The library is actually pretty powerful in terms of manipulating the DOM, so you could theoretically use it as a replacement for jQuery.
#3: Data Loading and Binding
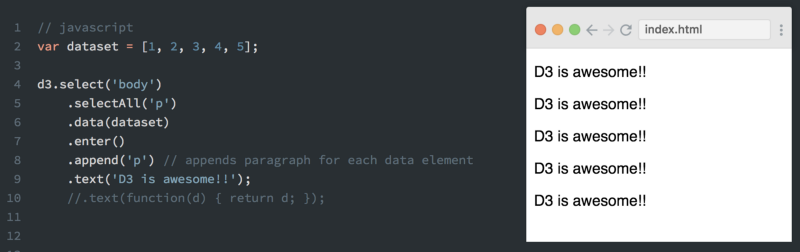
As you’re going to create visualizations, it’s important to learn how to load data in and also how to bind it to the DOM. So in this lecture, you’ll learn that.
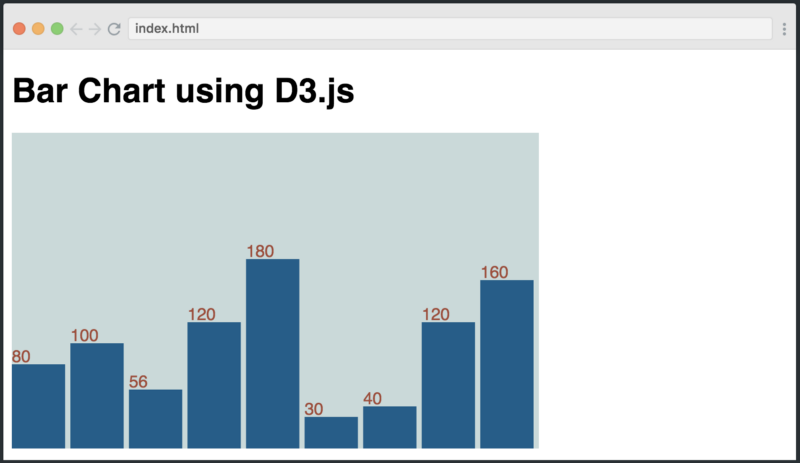
#4: Creating a simple bar chart
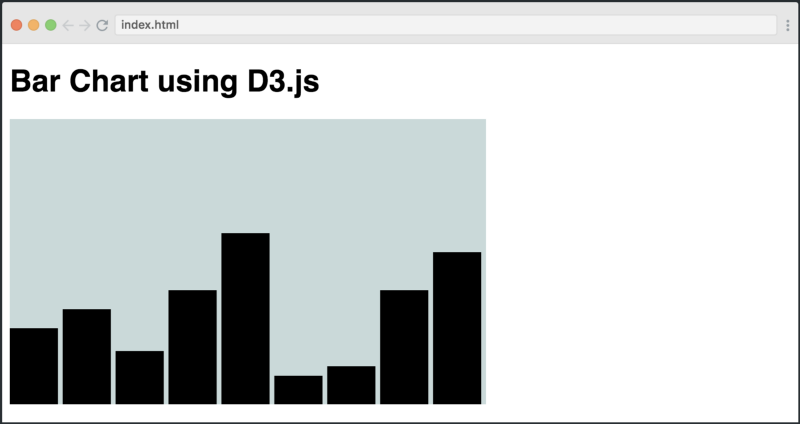
In the third lecture, you’ll learn how to build your very first visualization: a simple bar chart. The reason we’re introducing you to building stuff so early on is that it’s much more fun to create visualizations than simply talking about theory. So we think you’ll enjoy this lesson.
#5: Creating labels
The next step is to add labels to the bar chart, as you often would want to do this in real life. This is a short and simple lecture. Here, I’d recommend you to play around with the positions of the labels, as that’s a simple and fun way of interacting with the code.
#6: Scales
Scales are a critical concept in D3. They allow you to map your data to other relevant ranges, for example, the amount of space you have available. So in this lecture, you’ll learn about the scaleLinear() method:
var yScale = d3.scaleLinear()
    .domain(\[0, d3.max(dataset)\])
    .range(\[0, svgHeight\]);
#7: Axes
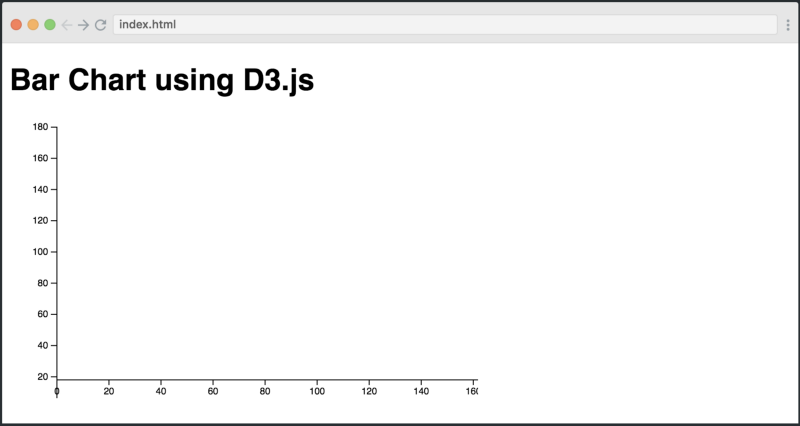
Axes are an integral part of any chart, and D3 provides you with a few simple methods for creating them. This lesson builds upon the last one, as it takes advantage of scales when creating the axes. It also sets you up for understanding the super-cool line chart you’ll learn in the final screencast of the course.
#8: Creating SVG elements
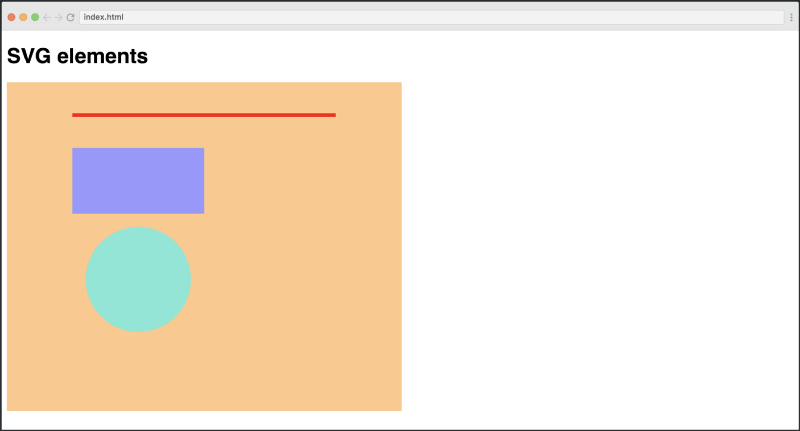
Even though you’ve already created SVG elements previously in the course, it’s such an important concept that it deserves its own lecture. In it, you’ll learn about the <rect>, <circle> , and <line> elements.
#9: Creating a pie chart
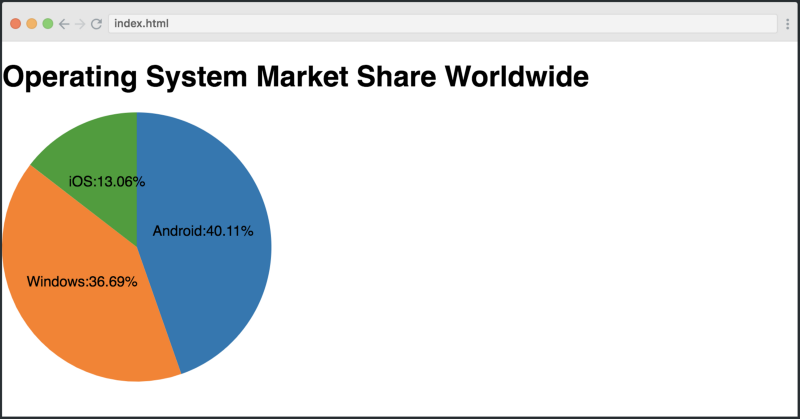
Pie charts are handy in many cases, so in this lecture, you’ll learn how to create one. D3 provides a simple API for doing this, so it shouldn’t be difficult for you at this point.
#10: Creating a line chart
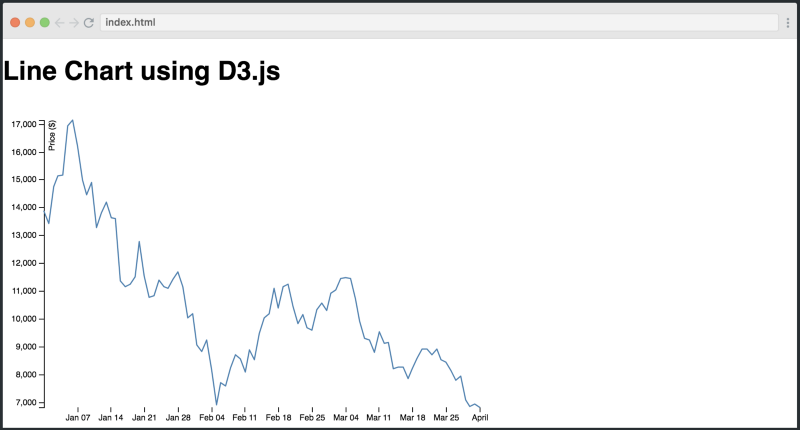
Finally, you’ll learn how to create a line chart to visualize the Bitcoin price. To get the data, you’ll use an external API. This project will also tie together a lot of the concepts you’ve learned throughout the course, so it’s a great visualization to end with.
And that’s it! After going through these ten lessons, you should be well set up for starting to use D3.js in your job or for personal projects.
If you reach this point, we’d really appreciate if you’d give Sohaib a shout-out on Twitter!
The Scrimba format
Before you leave, let’s also have a quick look at the technology behind the course. It’s built using Scrimba, an interactive coding screencast tool. A “scrim” looks like normal video, however, it’s fully interactive. This means that you can edit the code inside the screencast.
Here’s a gif which explains the concept:
Pause the screencast → Edit the code → Run it! → See your changes
This is great for when you feel you need to experiment with the code in order to properly understand it, or when you simply want to copy a piece of the code.
So what are you waiting for? Head over to Scrimba and take the free course today!
Thanks for reading! My name is Per Borgen, I'm the co-founder of Scrimba – the easiest way to learn to code. You should check out our responsive web design bootcamp if want to learn to build modern website on a professional level.