
by Gupta Garuda
Migrating from AngularJS to React — how do you measure your performance gains?

Are you looking into migrating a large AngularJS single page application to React? If so, you may be wondering what sort of performance gains you are going to get with React and how the code will morph (with state management libraries Redux or Mobx).
In this post, I’ll try to answer some of these questions, and give you a lot of data you can use to make more informed decisions.
First, I will go over the performance and memory profiles of various UI scenarios implemented using AngularJS, React/Redux and React/Mobx. We will compare and contrast the performance of these frameworks on measures like script execution time, frames per sec, and usedJSHeapSize for each scenario.
I provided the links to the test pages and source code so you can try out those scenarios and can review the code to get a feel for constructs that React (with Redux or Mobx) will bring to the table.
Performance test setup
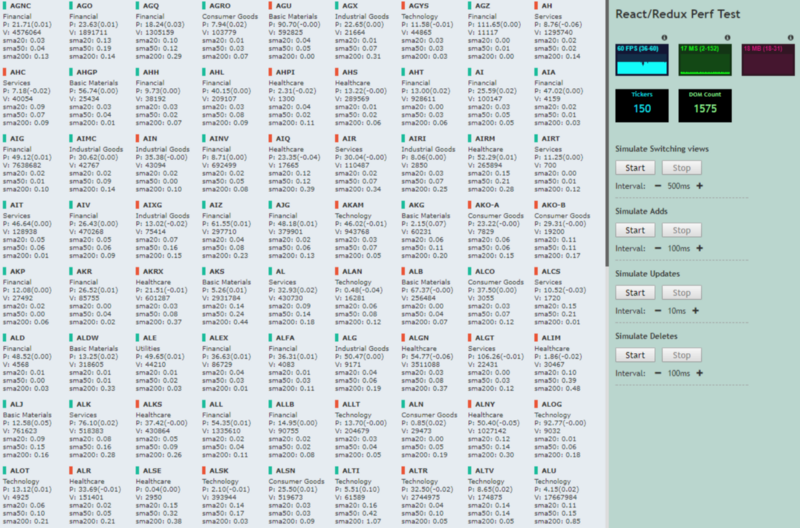
To evaluate the performance of AngularJS and React, I created a benchmark application, a stock ticker dashboard. This application shows a list of stocks and has some controls to automate UI test actions. For each stock, the application shows the ticker symbol, company name, sector name, current price, volume and simple moving averages (10 days, 50 days and 200 days), and a visual indicator showing whether the price went up or down. The test dataset consists of 5000 stock tickers and is loaded during the page load via a script tag.
I created three versions of this application using AngularJS, React/Redux, and React/Mobx. This enables us to easily compare the performance metrics for each scenario across the frameworks.
Test Scenarios
- Switching views
We navigate through a list of 5000 stock tickers showing 150 tickers at a time every 0.5sec. This scenario measures how quickly the framework can update the view when the visible collection data model changes.
Real world use-case: route changes, paging through a listview, virtual scroll, and so on. - Adding tickers
We add 50 tickers to the visible collection every 100ms until we show the entire collection of 5000 tickers. This scenario measures how quickly the framework can create new items. Showing 5000 tickers is not a realistic scenario, but we can visualize the limits where things will fall apart with each framework.
Real world use-case: Pinterest style infinite scroll where new UI elements are added to the DOM as the user scrolls. - Quick Updates on Price/Volume
We render 1500 tickers and start updating price/volume data for random tickers once every 10ms. This scenario measures how quickly frameworks can apply the partial updates to the UI.
Real world use-case: updates to presence indicators, likes, retweets, claps, stock prices, and so on. - Removing tickers
We will first add all 5000 tickers and then start removing 50 tickers from the visible collection once every 100ms.
Links to test pages and source
All the examples are written in Typescript and the compilation/bundling is done using Webpack. The Readme page for source URL lists the instructions to build and run the applications.
- AngularJS — https://guptag.github.io/js-frameworks/AngularJS/examples/angularjs-perf-test/index.html (Source)
- React/Redux — https://guptag.github.io/js-frameworks/Redux/examples/redux-perf-test/index.html
(Source) - React/Mobx — https://guptag.github.io/js-frameworks/Mobx/examples/mobx-perf-test/index.html
(Source)
Before we start…
- All the below metrics are measured on Win10/Intel Xeon E5 @ 2.4GHz, 6 core, 32GB desktop with Chrome browser v60. The numbers will change on different machines/browsers.
- To see the accurate heap memory data on the test pages, open Chrome with ‘--enable-precise-memory-info’ flag.
- React is a library rather than a full-fledged framework like AngularJS. In this post, I used the term framework for simplicity.
- Test pages show live JavaScript heap size as Memory.
About javascript heap size: In Chrome TaskManager,
In Chrome TaskManager, “The Memory column represents native memory. DOM nodes are stored in native memory. If this value is increasing, DOM nodes are getting created. The JavaScript Memory column represents the JS heap. This column contains two values. The value you’re interested in is the live number (the number in parentheses). The live number represents how much memory the reachable objects on your page are using. If this number is increasing, either new objects are being created, or the existing objects are growing. From Fix Memory Issues by Kayce Basques
- About Frames per second:
Most devices today refresh their screens 60 times a second. If there’s an animation or transition running, or the user is scrolling the pages, the browser needs to match the device’s refresh rate and put up one new picture, or frame, for each of those screen refreshes. Each of those frames has a budget of just over 16ms (1 second / 60 = 16.66ms). In reality, however, the browser has housekeeping work to do, so all of your work needs to be completed inside 10ms. When you fail to meet this budget, the frame rate drops, and the content judders on screen. This is often referred to as jank, and it negatively impacts the user’s experience. From Rendering Performance by Paul Lewis
DOM - AngularJS Components vs. React Components
AngularJS directives (or components) create an extra wrapper element around the template. For simple views, this is not an issue. However, in complex views containing a large number of directives (especially when they are repeated within ng-repeat), all the extra elements will add up to the total size of the DOM tree — potentially impacting memory, selector performance, and so on.
Although you can set ‘replace=true’ property to disable rendering the wrapper element, it causes a bunch of issues and is currently marked as deprecated.
Here is the rendered HTML for the ticker component in AngularJS:
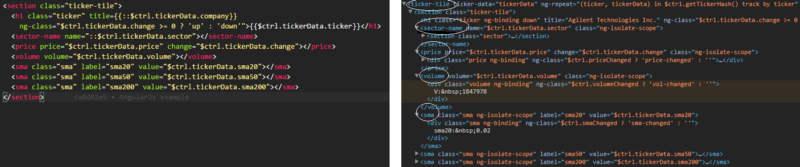
Here is rendered HTML for the similar ticker component in React:
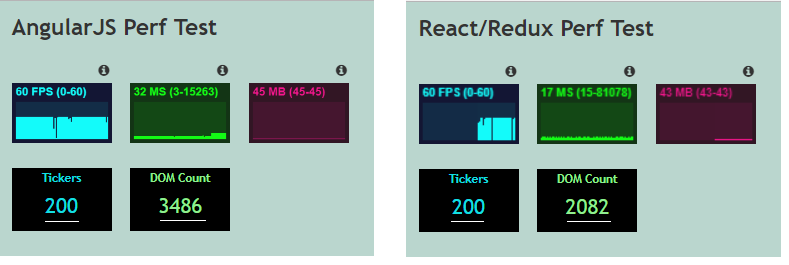
In our specific example, AngularJS created an additional 1400 DOM nodes compared to React for rendering the same number of tickers (200).
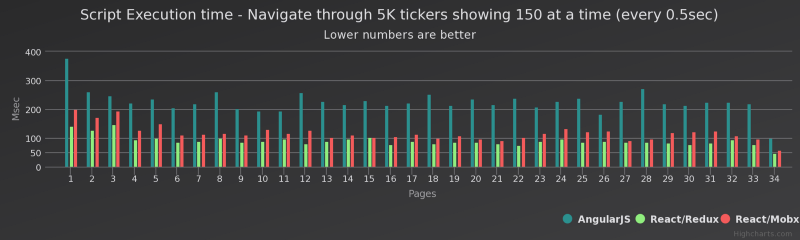
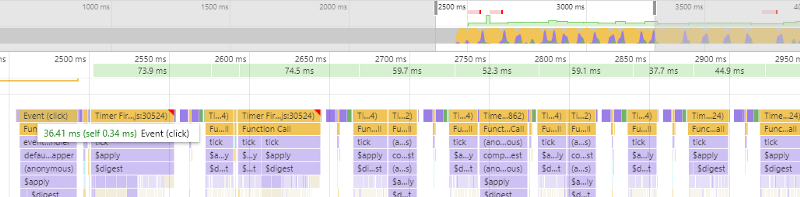
Scenario 1 — Switching Views
We navigate through a list of 5000 tickers showing 150 tickers at a time every 0.5sec.
The below chart plots the script execution time for each refresh from Chrome’s performance timeline. AngularJS consistently took >200ms to delete the existing 150 tickers and to show the new ones. Whereas React/Redux did the same work within 90–100ms (half the time compared to ng1). The React/Mobx version took slightly more time than the Redux version, but not far from it.
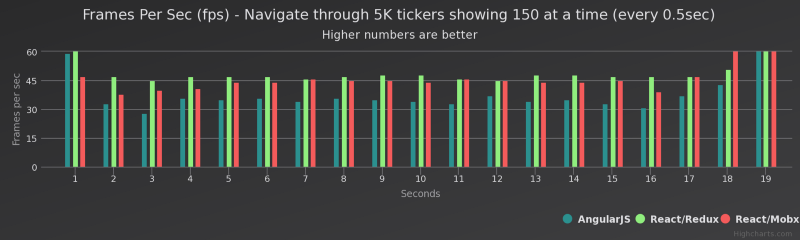
The below chart shows the frames per sec(fps) as the refresh happens. The Redux and Mobx versions stayed around 45fps whereas AngularJS stayed around 30 fps during the entire run.
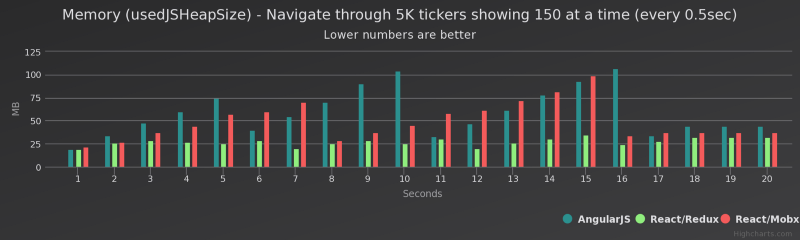
Memory & GC pauses
The below chart shows the JavaScript heap size (‘usedJSHeapSize’) measured during the refresh. Both the AngularJS and Mobx versions showed a staircase pattern for the memory consumption, indicating that Chrome kicked in the GC to reclaim the memory. The Redux version is super consistent with its low memory profile all throughout the run.
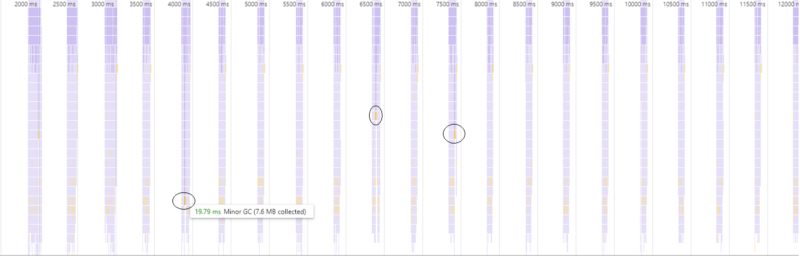
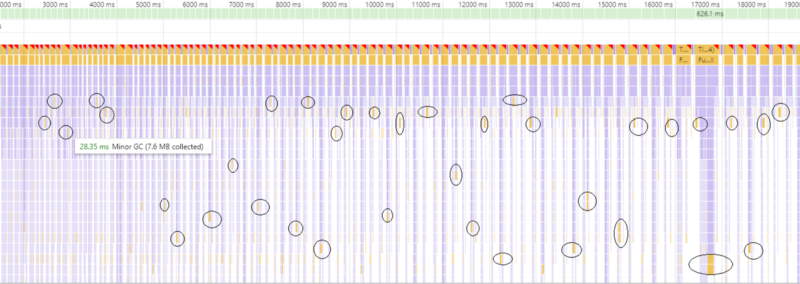
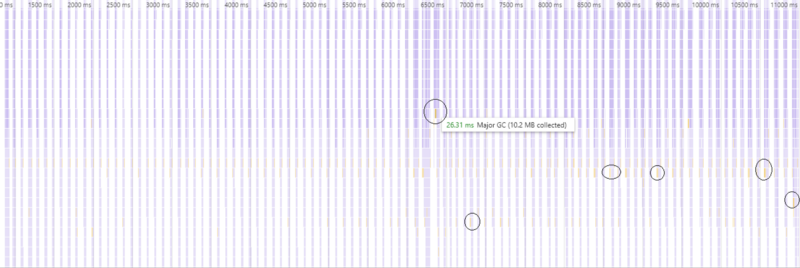
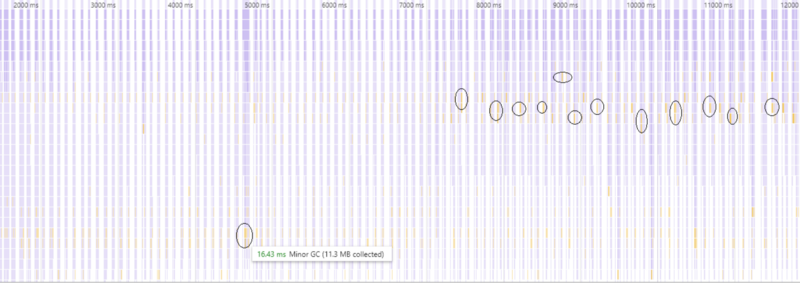
Let’s closely look into the timeline profiles for all the three versions.
AngularJS execution caused several GC pauses as the ticker list gets refreshed. V8 tries to hide GC pauses by scheduling them during the unused chunks of idle times to improve the UI responsiveness. Contrary to this ideal behavior, GC pauses happened during the script execution contributing to the overall execution time.
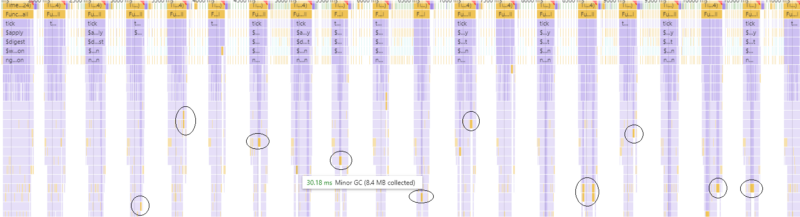
The Redux performance profile shows no GC pauses whatsoever during the script execution.
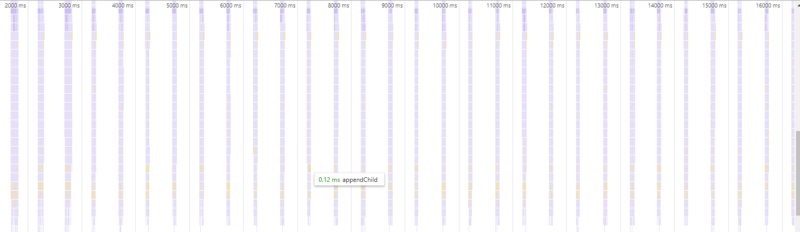
The Mobx profile shows few GC pauses, but not as many as the AngularJS version.
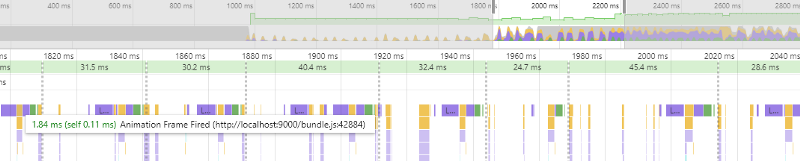
Scenario 2 — Adding Tickers
We will add 50 tickers to the visible collection every 100ms until we show all the tickers. The result of showing all 5000 tickers is not a realistic scenario, but it would be interesting to see how each framework handles it.
The below chart plots the script execution time from Chrome’s performance timeline. In the case of AngularJS, the script execution time linearly increased as more and more tickers were added to the page. AngularJS took more time to add new tickers right from the start compared to the other versions.
Interestingly, the Redux and Mobx versions show impressive performance even towards the right side of the chart with thousands of tickers on the page. React’s virtual DOM diffing algorithm is showing its strength compared to AngularJS’s dirty checking.
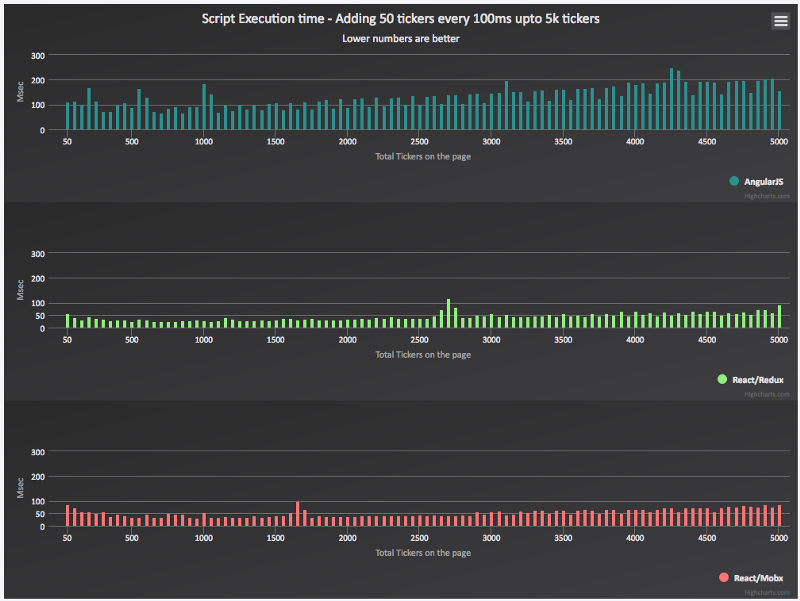
With AngularJS, adding new items caused jank in the browser right from the start (red bars) and the number of frames per second dropped from 60 early on and never recovered (green area) during the entire add operation.

Redux created jank once early-on, but it is all clear until we crossed the halfway point of adding new tickers. FPS also nicely recovered to 60 in between the add operations.

Mobx caused jank few times more times than Redux, but nowhere close to AngularJS.

Memory & GC events
Redux consumed about half the heap size as AngularJS during the entire run. Mobx stayed in between.
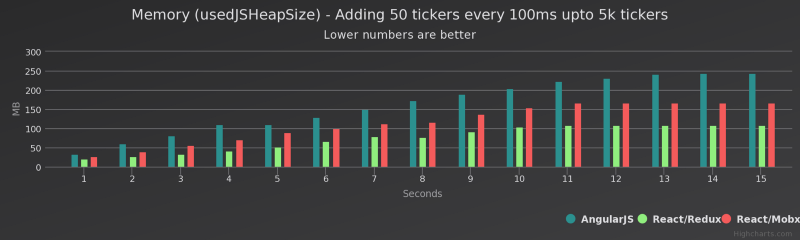
Adding new tickers also triggered some GC pauses with AngularJS (almost once with every add operation). Redux triggered fewer GC pauses overall. Mobx started to trigger more GC pauses towards the end as we added more and more tickers to the list.
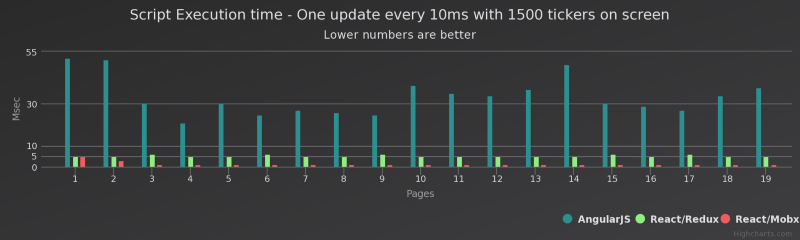
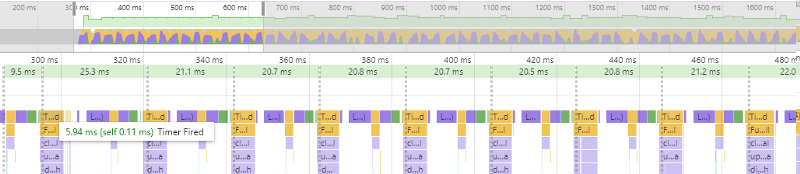
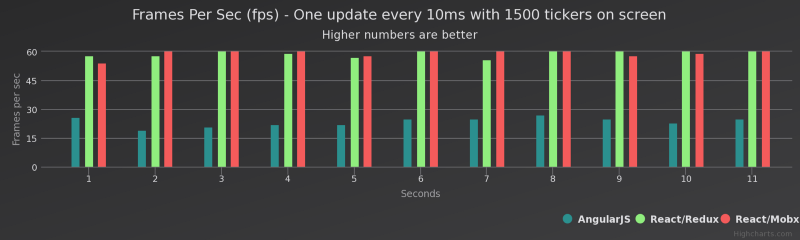
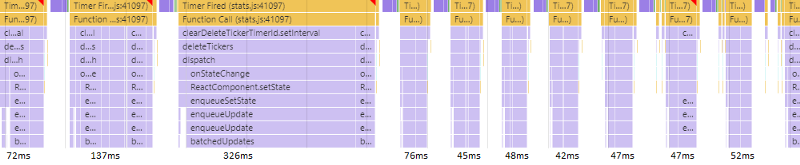
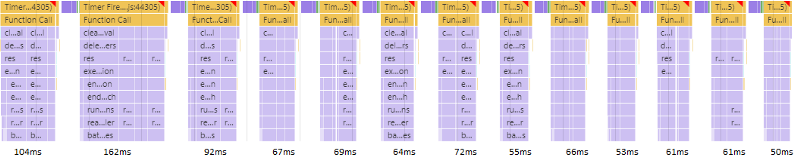
Scenario 3 — Quick Updates to Price/Volume
This is the most common scenario in the real-time applications. Once the view is rendered, there will be a quick succession of updates coming into the application either via web-sockets, xhr calls, and so on. Imagine the use-cases like presence updates, stock price changes, likes/retweets/claps count changes, and more. Let’s see how each framework fares in this scenario.
All the below metrics are taken with 1500 tickers on the page and when price/volume changes are happening every 10ms.
AngularJS again struggled to keep up with the updates happening in quick succession. Script execution for each update took about 35ms. Redux took 6ms to update the view. Mobx shines, updating the view within 2ms. Mobx’s derivation graph knows exactly which component to update based on which observable’s state is changed.
Here are the timeline profiles showing the script execution for each version.
FPS consistently stayed at 60 with Redux and Mobx, whereas it hovered a little below 30 with AngularJS.
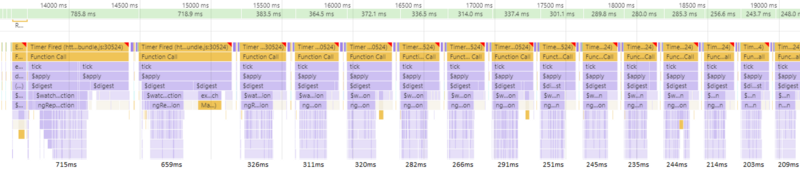
Scenario 4 — Deleting Tickers
We will add all 5000 tickers to the page and start removing 50 tickers from the visible collection every 100ms.
The below images show the performance profile of the initial delete iterations. AngularJS is almost 4x slower compared to React versions. Redux and Mobx took a little more time in the initial iterations but settled between 50–70ms for each delete operation.
It’s pretty clear from all the above tests that React gives significant performance gains when compared with AngularJS.
As the applications grow bigger and views get more complex, the runtime profile of the frameworks starts to differ in their various ways. Our objective was to replicate the scenarios we were targeting for, measure the performance/memory impact, and look at the pro/cons of the constructs with each framework.
Even with the most performant framework out there, we still need to apply a lot of discipline and follow the right patterns to make the applications scalable and performant.
I go over the core concepts, benefits, and gotchas of Redux and Mobx in a separate post.
Thanks for reading. Hope this is helpful.
P.S. Thanks to Shyam Arjarapu and Adam Carr for reviewing this article.