
by Ray Naldo
Multi-User Debugging in PhpStorm
Using Xdebug and DBGp Proxy

“Er, wait a minute… Don’t you just use xdebug.remote_connect_back which has been introduced since Xdebug 2.1?"
Sure if the web server is only accessible by the developers (e.g. private development server), and if it’s not running behind a NATted firewall, and if you want this guide to end here. See those IFs? Personally, I don’t like IF in programming or in life. So this guide will take the longer way which doesn’t need an IF to start (or at least fewer IFs), that is by using Xdebug’s DBGp proxy.
When a proxy is used, the PHP Xdebug extension no longer connects to PhpStorm directly, but instead connects to the DBGp proxy server. All developers in the team, in turn, then connect to that proxy. Each developer has a separate debugging session running over this proxy, which makes it possible to do multi-user debugging of the same code on the same server.
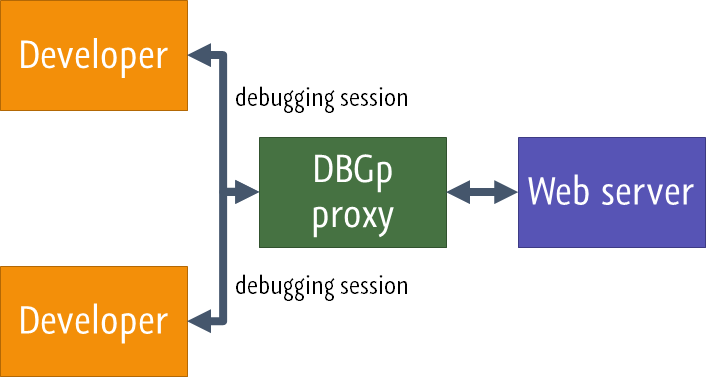
So, with DBGp proxy you can limit who can connect to the proxy, and you may have multiple developers debugging the same web server running behind a NATted firewall.
Running a DBGp proxy also allows you to avoid NAT issues where (as seen from PHP+Xdebug on the server) all connections seem to come from the same IP (because your internal network is NATted). In this case, you can simply run the dbgp proxy on your NAT machine, configurexdebug.remote_hostsetting to the IP address of your NAT machine, and configure the IDEs to connect to the proxy running at<NAT-machine>;:9001.
— https://derickrethans.nl/debugging-with-multiple-users.html
Setup
Mappings between the project folders and the folders on the server should be done correctly in PhpStorm first for debugging to work.
Setup Web Server
Although this guide assumes the web server is running on Linux, the guide could also be used on non-Linux web servers with slight modifications.
1. Install Xdebug.
# PHP 7+pecl install xdebug # PHP 5.6.xpecl install xdebug-2.5.52. Enable Xdebug extension, then add the following Xdebug configuration to php.ini:
[xdebug]zend_extension="<full_path_to_xdebug.so>"; debugger settingsxdebug.remote_enable=1xdebug.remote_host=127.0.0.1xdebug.remote_port=9000For this guide, DBGp proxy will run on the same machine as the web server and will use Xdebug’s default port, hence 127.0.0.1:9000.
3. Download and install DBGp proxy for remote debugging from Komodo Remote Debugging Package, specifically for your web server’s operating system. This guide will be using 64-bit Linux and PHP Remote Debugging client v11.1.0. Extract the archive; for simplicity I extract all the contents to my home directory i.e. /home/ray/.
4. Run DBGp proxy by executing pydbgpproxy file with parameters:
-d <ip_address:port> to set IP address and port of the machine which will be receiving debugger connection from the web server-i <ip_address:port> to set IP address and port of the machine which will be receiving debugging connection from developer computer
In this guide, web server and DBGp proxy will be run on the same machine. If the IP address is 10.211.1.32 and we want to run the proxy on port 9001 then the command will be:
pydbgpproxy -d 127.0.0.1:9000 -i 10.211.1.32:9001For convenience we could use this script, saved as start-dbgp-proxy.sh.
I placed it on the same directory as pydbgpproxy i.e. /home/ray/start-dbgp-proxy.sh) :
ip=$(hostname -I | awk '{$1=$1};1')pydbgpproxy -d 127.0.0.1:9000 -i $ip:90015. Make sure to allow connection from localhost on port 9000, and from developer machines on port 9001.
6. Run start-dbgp-proxy.sh. Add execute file permission if you can't run it.
start-dbgp-proxy.shMake sure it can be run without a problem.
INFO: dbgp.proxy: starting proxy listeners. appid: 30430INFO: dbgp.proxy: dbgp listener on 127.0.0.1:9000INFO: dbgp.proxy: IDE listener on 10.211.1.32:90017. (Optional) Auto-start start-dbgp-proxy.sh on each machine startup by using crontab.
Edit crontab:
crontab -eAdd cron job to auto-start start-dbgp-proxy.sh on each startup:
@reboot /home/ray/start-dbgp-proxy.shSetup Client
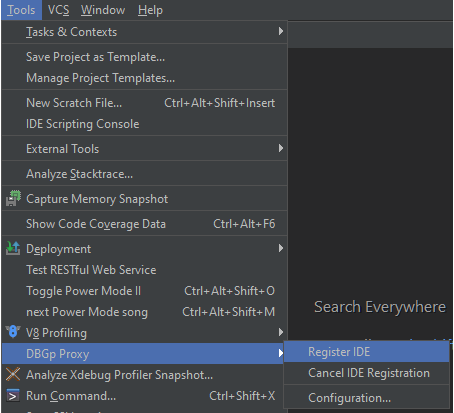
1. Access menu Tools > DBGp Proxy > Register IDE on PhpStorm.
2. Fill IDE key with unique string between developers. FillHost andPort with DBGp proxy's IP address and port (parameter -i on Setup Server #4).
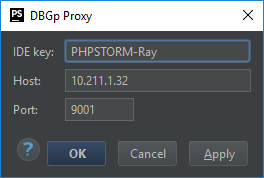
3. Click OK. You should see a success notification popup. If you don’t see it, re-register IDE via Tools > DBGp Proxy > Register IDE. If it's failed or you want to change the configuration, do it via Tools > DBGp Proxy > Configuration...
4. (Optional) If you want to initiate debugging connection from the web browser, it’s recommended to install a debugging extension on your browser: Xdebug Helper Firefox or Xdebug Helper Chrome. Then configure your Xdebug Helper.
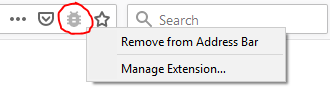
On Firefox, right click Xdebug Helper icon > Manage Extension… > Options On Chrome, right click Xdebug Helper icon > Options
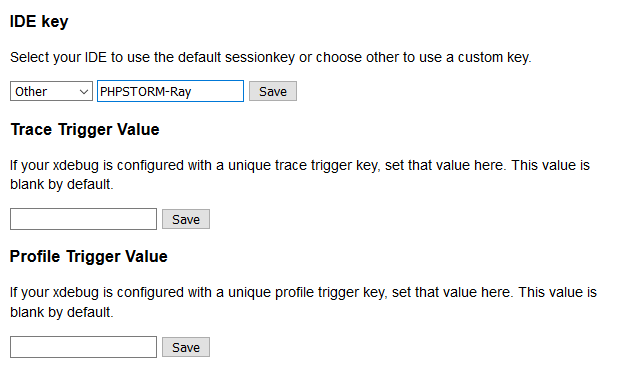
Fill and save IDE key with the same unique string as when you're registering the IDE (Step #2).
Start Debugging
1. Set breakpoint(s) on PhpStorm.
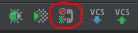
2. Start listening to debug connection in PhpStorm by clicking the ‘phone’ button on the upper right toolbar or from menu Run > Start Listening for PHP Debug Connections. This will enable PhpStorm to react and opens the Debug window automatically when a debugging session is started.
3. Activate Xdebug’s debugger when doing a request. According to Xdebug Documentation there’re 3 ways to do this. But IMHO, the best way which works for all kinds of HTTP methods is by setting a cookie named XDEBUG_SESSION with value <IDE_key> which is the same unique string when we register our IDE to DBGp proxy (Setup Client #2).
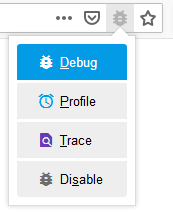
- In the web browser, the cookie will be set automatically by Xdebug Helper extension
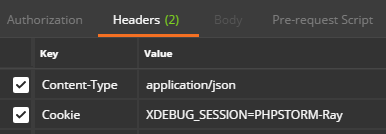
- In Postman, the cookie can be set in Request Headers
4. Run the script with the cookie already set.
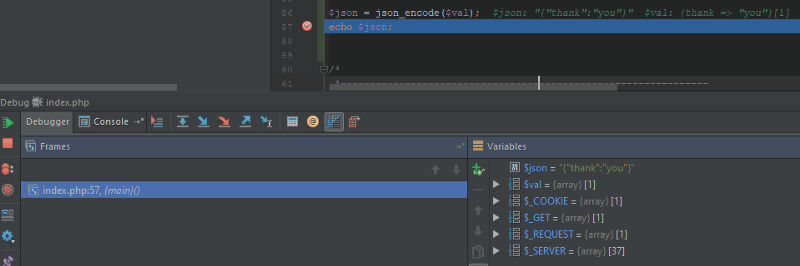
5. On success, PhpStorm will show the Debug window automatically.
6. Make sure to unset/don’t send the cookie to disable debug and stop listening debug connection in PhpStorm if you’re not doing any debugging. If you fail to do so, it will make the DBGp proxy hang when there’s too many hanging connections.
Hope this guide works for you.
Thank you for reading!