by Adam Henson
How to improve performance in your apps with Lighthouse, Webpack, and React Loadable Components
An overview of modern concepts, tools and example strategies to improve web page performance

In March of 2018 Google confirmed rumors by announcing the migration of sites for “mobile-first” indexing.
What this Means
Mobile-first indexing means Google will predominantly use the mobile version of the content for indexing and ranking. Historically, the index primarily used the desktop version of a page’s content when evaluating the relevance of a page to a user’s query. Since the majority of users now access Google via a mobile device, the index will primarily use the mobile version of a page’s content going forward. We aren’t creating a separate mobile-first index. We continue to use only one index.~Prepare for mobile-first indexing
“Yikes!” — you may be thinking. This is a reasonable reaction for anyone owning a website relying on organic search results for its success. Consider extreme examples of websites that drive millions of dollars a day who’ve come to depend on such rankings. Many of these websites weren’t necessarily built to support mobile devices as the highest priority.
Confronting Performance
The first step in ensuring optimal performance of a web page on a mobile device is to understand key metrics in modern testing. We can go straight to the source by utilizing Lighthouse, Google’s open-source tool. You can run it in Chrome DevTools, from the command line, or as a Node module.
Lighthouse has a variety of options to allow performance testing under a variety of conditions, specifically notable being device and connection type.
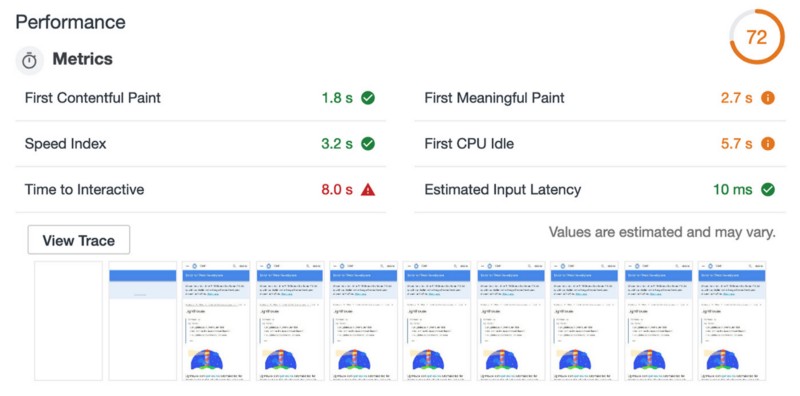
Lighthouse Metrics and Scoring
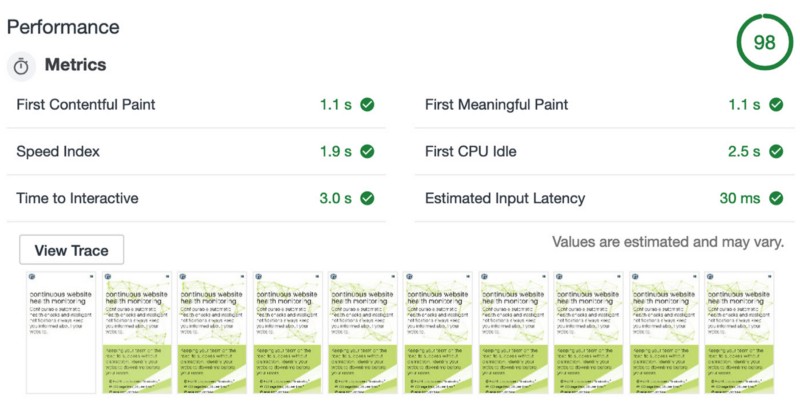
In a Lighthouse performance audit, results are provided as a set of metrics with values. The score is a number between 0 and 100 where the higher number is better. Score is calculated by a weighted group of select metrics as explained in the documentation.
Load is not a single moment in time — it’s an experience that no one metric can fully capture. There are multiple moments during the load experience that can affect whether a user perceives it as “fast” or “slow”.
~ Paint Timing Spec
Not only does each metric capture a characteristic of page load, but each metric can encompass the results of others.
Opportunities for Improvement and Solutions
I’ve identified a few commonly low metrics with fairly straightforward solutions, depending on complexity. “Time to Interactive” is one of the most important.
Time to Interactive
At the time of this writing, the “Time to Interactive” metric is weighted highest in its influence on the overall performance score.
The Time to Interactive (TTI) metric measures how long it takes a page to become interactive. “Interactive” is defined as the point where:
The page has displayed useful content, which is measured with First Contentful Paint.
Event handlers are registered for most visible page elements.
The page responds to user interactions within 50 milliseconds.
To improve your TTI score, defer or remove unnecessary JavaScript work that occurs during page load. See Optimize JavaScript Bootup and Reduce JavaScript Payloads with Tree Shaking, and Reduce JavaScript Payloads with Code Splitting.
~Time to Interactive
Improving Time to Interactive
Webpack provides sophisticated customization nowadays to improve optimization. It provides out of the box configuration options to split code and prevent duplication as illustrated in the documentation. By using Webpack Bundle Analyzer, we can visualize the outcome of a “prevent duplication” code splitting approach.
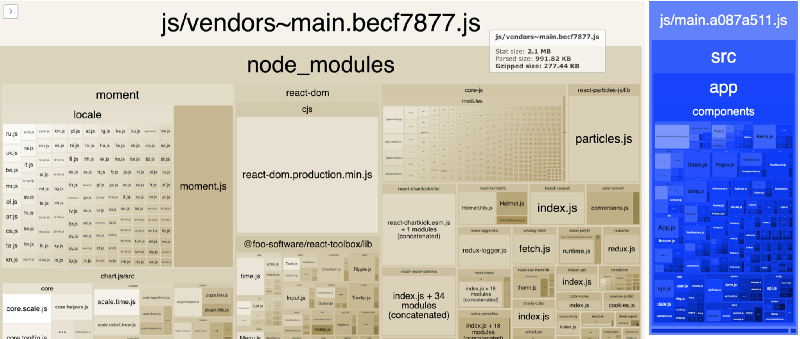
Okay, well… could be worse ?! The important part is we separated common code. By doing this alone we relieve work from the main execution thread, provide asset caching potential, and other interesting things as detailed by Addy Osmani and Jeremy Wagner. But wait… there’s more!
Dynamic Code Splitting
We talked about one approach above. Another code splitting technique supported by Webpack involves the use of dynamic imports. I accomplished this fairly easily with staggering results by using Loadable Components to handle rendering in my “universal” app. I chose this library in its support of “Server Side Rendering” and documentation of it. It provides a Babel Plugin (which delegates chunks under the hood during build) and a Chunk Extractor — to collect chunks server side and provide script tags on page render. This seems confusing, so enough with the words… let’s role up our sleeves!
Imagine a page component, defined with a dynamic import.
And to process and delegate Loadable Components during build, we can configure Webpack with the Babel plugin (mentioned above).
In our client side render entry, we wrap in Loadable Ready. Loadable Components loads all your scripts asynchronously to ensure optimal performance. All scripts are loaded in parallel, so you have to wait for them to be ready using loadableReady .
On server side render, Loadable Components ChunkExtractor provides only the script tags used by initial page load and the rest asynchronously, client side! JS is loaded on-demand, behind the scenes.
Dynamically extracting script and style tags needed by a particular page is quite powerful. I used dynamic imports in all page components and components that uniquely import heavy libraries. What a difference! ?
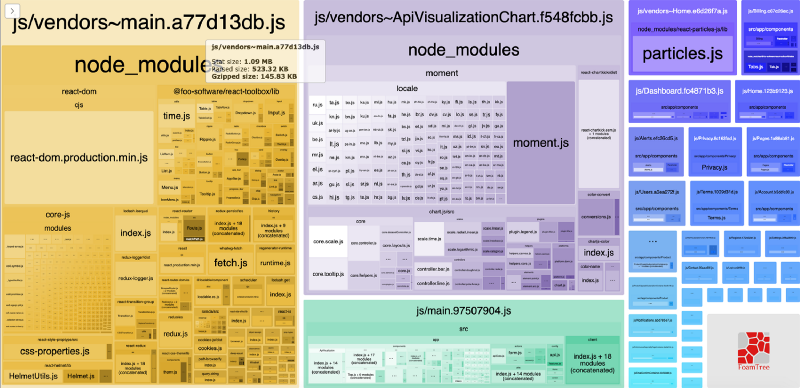
We reduced the main vendor bundle by more than 100kb. The blue squares in the image above represent bundles created with dynamically imported page components. The large violet square in the top middle is a vendor split bundle from one specific component I identified as uniquely importing large libraries.
Okay, Did We Actually Do Anything?
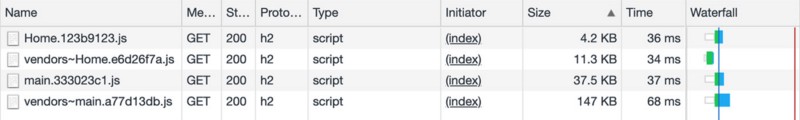
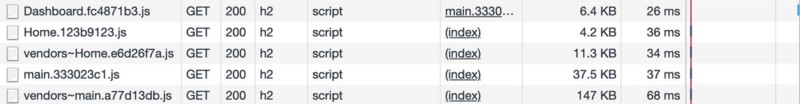
The short answer is — yes!! We can see how JS is loaded by examining the network panel in Chrome Dev Tools. Let’s assume a request to a home page.
Okay, wait… it’s all coming back now…
An alternative to large bundles is code-splitting, which is where JavaScript is split into smaller chunks. This enables sending the minimal code required to provide value upfront, improving page-load times. The rest can be loaded on demand.
~ Reduce JavaScript Payloads with Code Splitting
Aha, we can see this in action here as a user navigates to another route client side. Assume the user navigates to a “dashboard” page from the home page. Dashboard.fc4871b3.js is downloaded on demand!
And… Google loves it! With the above changes, I saw a Lighthouse score improvement of more than 10 points. ?
Conclusion
By utilizing a recipe of modern tools and features, we can effectively identify, measure, visualize and address web page performance. This is important in accommodating Google’s mobile-first indexing. Key metrics documented by Google to measure performance, such as “Time to Interactive”, can help us pinpoint opportunities for improvement.