by Netta Bondy
The curious case of performance testing setTimeout(0)
(For full effect, read in a husky voice while surrounded by a cloud of smoke)

It all began on a gray fall day. The sky was cloudy, the wind was blowing, and someone told me that setTimeout(0) creates, on average, a 4 ms delay. They claimed that’s the time it takes to pop the callback off the stack, onto the callback queue and back on the stack again. I thought it sounded fishy (this is the bit you imagine me in black and white with a cigar in my mouth). Given that the rendering pipeline needs to run every 16 ms to allow smooth animations, 4 ms seemed like a long time to me. A very long time.
A few naive tests in the devtools with console.time()confirmed it. The average delay across 20 runs was about 1.5 ms. Of course, 20 runs does not a sufficient sample size make, but now I had a point to prove. I wanted to run tests on a larger scale that could get me a more accurate answer. I could then, of course, go and wave that in my colleague’s face to prove that they were wrong.
Why else do we do what we do?

The traditional method
Right away, I found myself in hot water. In order to measure how long it took setTimeout(0) to run, I needed a function that:
- took a snapshot of the current time
- executed
setTimeout - then exited immediately so that the stack would be clear and the scheduled callback could run and calculate the time difference
- and I needed that function to run a sufficiently large number of times so that the calculations were statistically meaningful
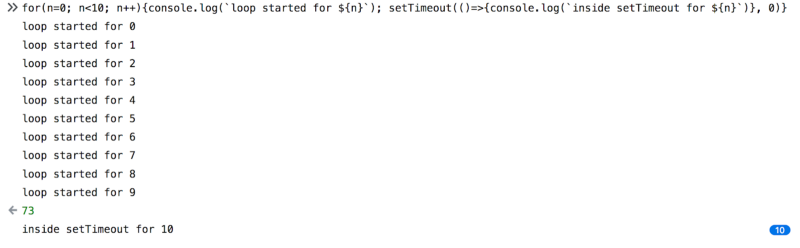
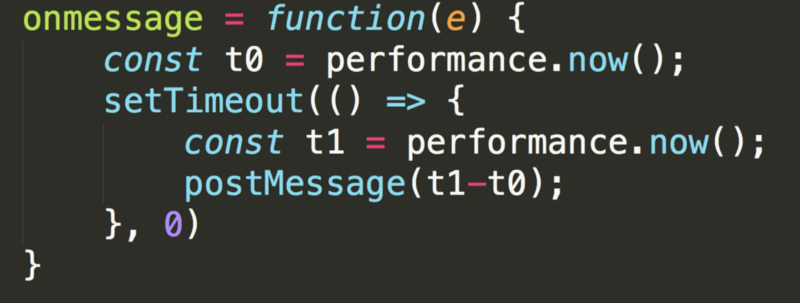
But the go-to construct for this — the for-loop — wouldn’t work. Because the for-loop doesn’t clear the stack until it has executed every loop, the callback wouldn’t run immediately. Or, to put it in code, we would get this:
The problem here was inherent — if I wanted to run setTimeout multiple times automatically, I would have to do it from within another context. But, so long as I ran from within another context, there would always be an additional delay from the time I started the test to the time the callback executed.
Of course I could slum it like some of these good-for-nothing detectives, write a function that does what I need, and then copy & paste it 10,000 times. I would learn what I wanted to know, but the execution would be far from graceful. If I was going to rub this in someone else’s face, I’d much rather do it another way.
Then it came to me.
The revolutionary method
I could use a web worker.
Web workers run on a different thread. So, if I place the setTimeout logic in a web worker I could call that multiple times.Each call would create its own execution context, calling setTimeout, and immediately exiting the function so the callback could execute. I had been looking forward to do some work with web workers.
It was time to switch to my trusted Sublime Text.
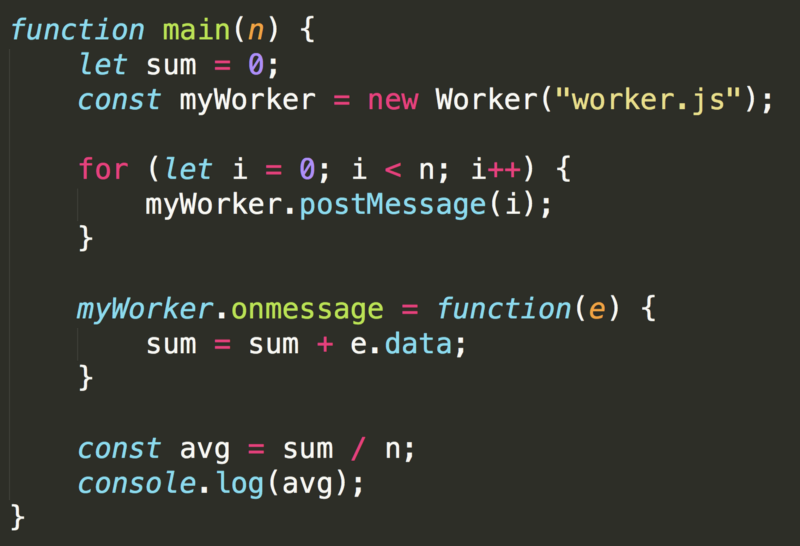
I started out just testing the waters. With this code in main.js:
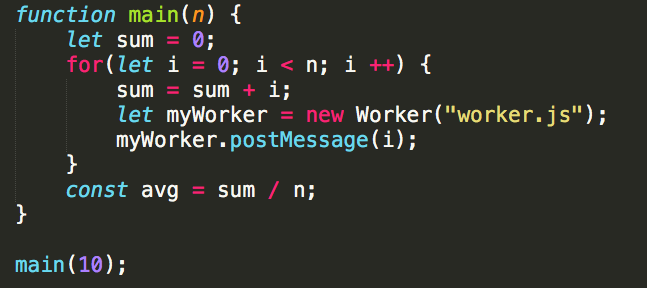
Some plumbing here to prep for the actual test, but initially I just wanted to make sure I could communicate properly with the web worker. So this was the initial worker.js:
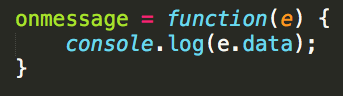
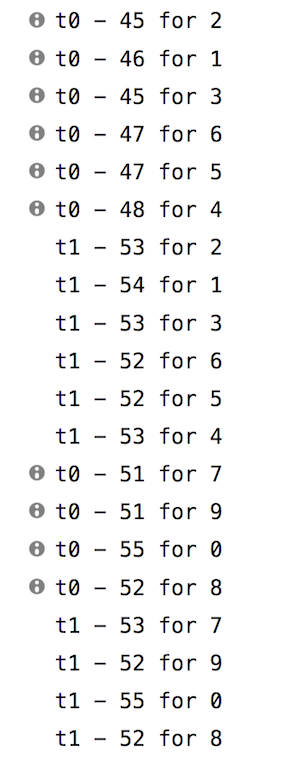
And while it worked like a charm — it produced results which I should have been expecting, but wasn’t:
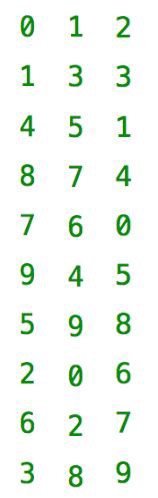
Being so used to synchronicity in JS, I couldn’t help but be surprised by this. The first moment I saw it my brain registered a bug. But, since each loop sets up a new web worker and they run asynchronously, it makes sense that the numbers won’t be printed out in order.
It may have surprised me, but it was working as expected. I could go ahead with the test.
What I wanted is for the web worker’s onmessage function to register t0, call setTimeout, and then immediately exit so as not to block the stack. I could, however, put additional functionality inside the callback, after I’ve set the value of t1. I added my postMessage into the callback, so it doesn’t block the stack:
And here is the main.js code:
This version has a problem.
Of course — since I’m new to web workers I hadn’t considered it at first. But, when multiple runs of the function kept printing 0, I figured something wasn’t right.
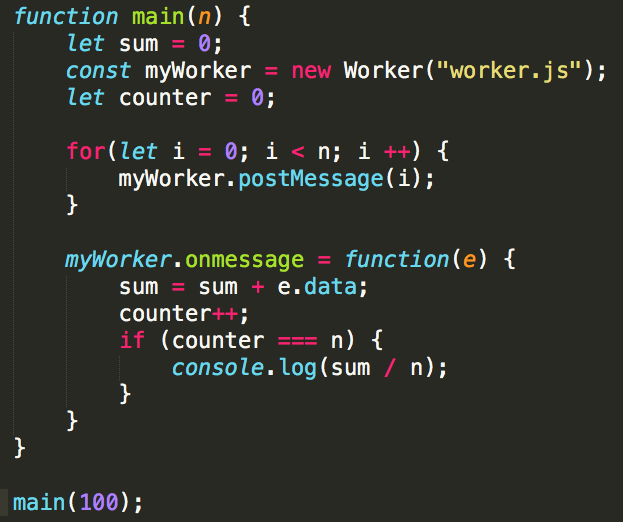
When I printed the sums from within onmessage I got my answer. The main function was moving on synchronously, and wasn’t waiting for the message from the worker to return, so it calculated the average before the web worker was done.
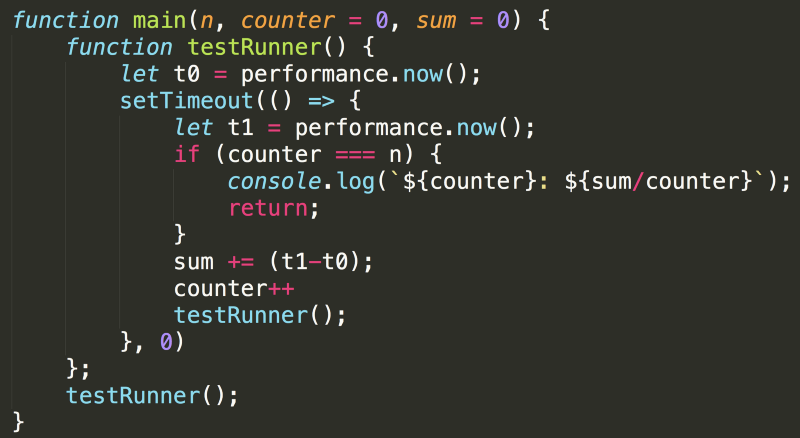
A quick and dirty solution is to add a counter and do the calculation only when the counter has reached the maximum value. So here is the new main.js:
And here are the results:
main(10): 0.1
main(100) : 1.41
main(1000) : 13.082
Oh. My. Well, that’s not great, is it? What’s going on here?
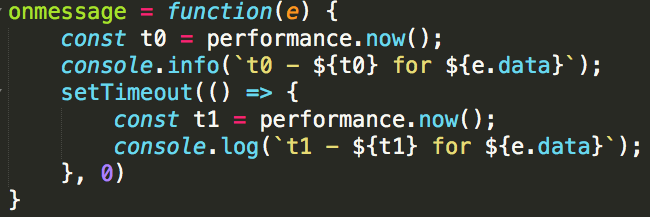
I sacrificed performance testing to get a look inside. I’m now logging t0 and t1 when they are created, just to see what’s going on there.
And the results:
Turns out my expectation of t1 being calculated immediately after t0 was also misguided. Basically the fact that nothing about web workers is synchronous means that my most basic assumptions about how my code behaves just don’t hold true anymore. It’s a difficult blind spot to see.
Not only that, but even the results I got for main(10) and main(100), which originally made me very happy and smug, were not something I could rely on.
The asynchronicity of web workers also makes them an unreliable proxy for how things behave in our regular stack. So, while measuring performance of setTimeout in a web worker gives some interesting results, these are not results which answer our question.
The textbook method
I was frustrated… could I really not find a vanilla JS solution which would both be elegant and prove my colleague wrong?
And then I realized— there was something I could do, but I wouldn’t like it.
I could call setTimeout recursively.
Now when I call main it will call testRunner which measures t0 and then schedules the callback. The callback then runs immediately, calculates t1 and then calls testRunner again, until it’s reached the desired number of calls.
The results of this code were particularly surprising. Here are some printouts of main(10) and main(1000):
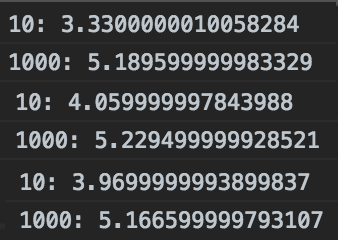
The results are significantly different when calling the function 1,000 times compared to calling it 10 times. I’ve tried this repeatedly and got largely the same results, with main(10) coming in at 3–4 ms, and main(1000) topping 5 ms.
To be honest, I’m not sure what’s happening here. I searched for an answer, but couldn’t find any reasonable explanation. If you’re reading this and have an educated guess of what’s going on — I’d love to hear from you in the comments.
The tried and true method
Somewhere in the back of my mind, I always knew it would come to this… Flashy things are nice for those who can get them, but tried and true will always be there in then end. Even though I tried to avoid it, I always knew this was an option. setInterval.
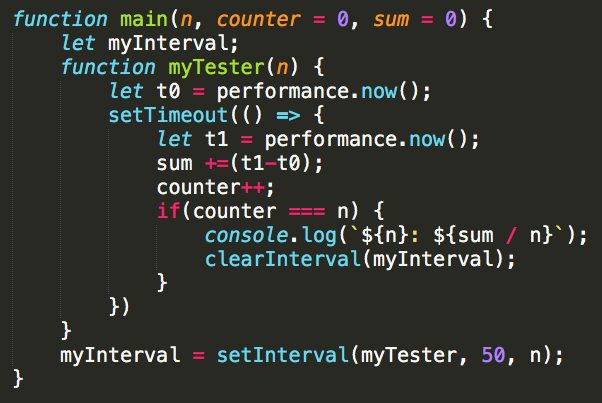
This code does the trick with somewhat brute force. setInterval runs the function repeatedly, waiting 50 ms between each run, to make sure the stack is clear. This is inelegant, but tests exactly what I needed.
And the results were also promising. Times seem to match my original expectation — under 1.5ms.


Finally I could put this case to bed. I’d had some ups and downs, and my share of unexpected results, but in the end only one thing mattered — I had proven another developer wrong! That was good enough for me.
Want to play around with this code? check it out here: https://github.com/NettaB/setTimeout-test